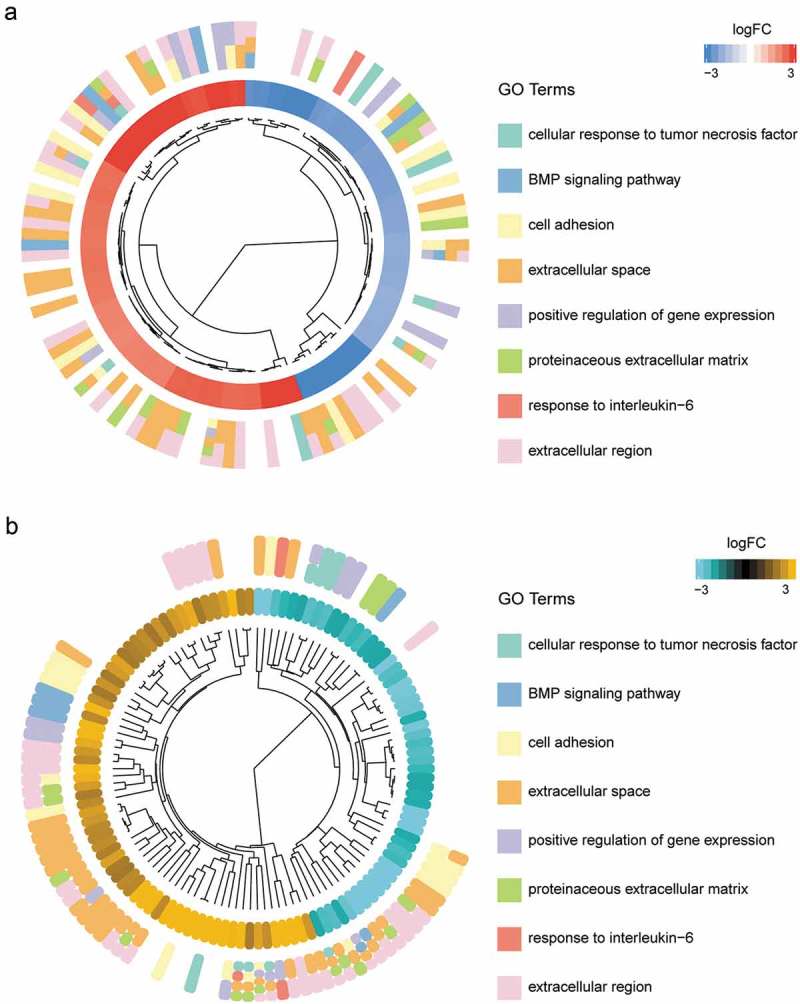
Figure 2.

Hierarchical clustering of GO terms. (a) The first ring next to the dendrogram represents the log2FC of the genes, which were actually the leaves of the clustering tree. Genes were grouped by their log2FC value. (b) Genes were clustered based on different terms. Most genes involved in extra cellular space were up-regulated while most genes in cellular response to tumor necrosis factor term were down-regulated.
