
Figure 2.
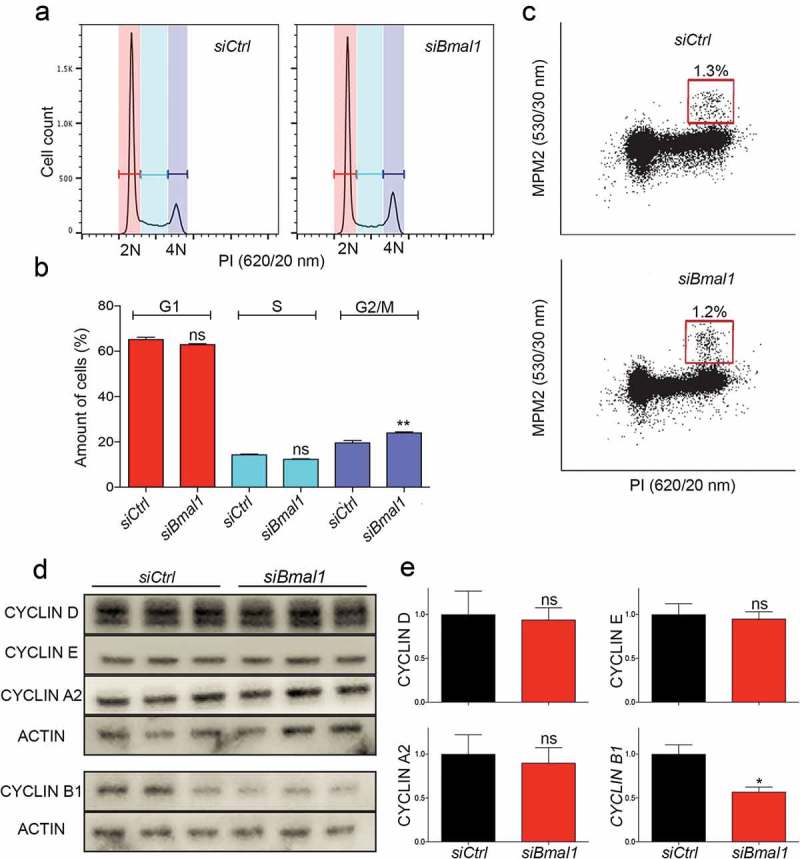
Cell cycle phase distribution of siCtrl and siBmal1 cells. (a) Flow cytometric analysis of cell cycle phases in siCtrl and siBmal1 cells. Shown are representative examples of propidium iodide (PI) stained siCtrl and siBmal1 cells, analysed for DNA content (n = 3 experiments). The vertical axis indicates the relative number of cells and the horizontal axis indicates the relative PI fluorescence. The 2N and 4N peaks and intermediate region correspond to G1, G2/M and S phase, respectively. (b) Quantification of cell cycle phase distribution of proliferating siCtrl and siBmal1 cells. Shown are the average cell numbers of the 3 independent experiments (each performed in triplicate; 20,000 cell counts per triplicate). The data were compared using the two-tailed unpaired Student’s t-test. Error bars indicate SE. ** p < 0.01. (c) Flow cytometry analysis of the number of mitotic cells. The bivariate dot plots show DNA content (PI) and mitotic phosphoproteins content (MPM2 stain) on the X and Y axis, respectively. The box marks cells stained positive for MPM2. (d) Western blot analysis of whole cell extracts from proliferating siCtrl and siBmal1 cells for Cyclin D1, Cyclin E, Cyclin A, and Cyclin B1 proteins. Shown are representative examples of n = 3 independent experiments. Actin was used as a loading control. (e) Average cyclin protein levels in proliferating siCtrl and siBmal1 cells (n = 3 independent experiments). Cyclin expression levels were normalized against actin. Cyclin expression levels in control cells were set as 1. Error bars indicate SD (n = 3 experiments).