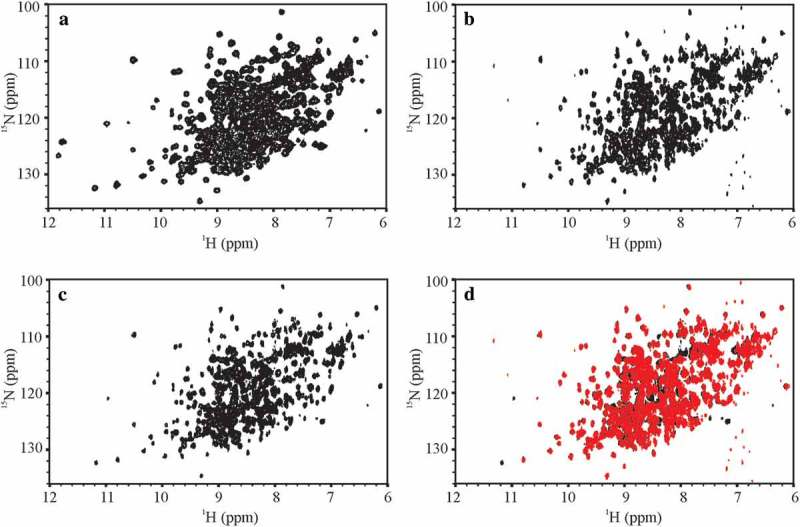
Figure 1.

Representative 500 MHz and 900 MHz 1H, 15N spectral fingerprints of the SSS and the NIST-Fab. (a) 1H, 15N gHSQC D1A-3897-009 spectrum of the SSS recorded with uniform sampling at 500 MHz; (b) 1H,15N SOFAST-HMQC E2C-8822-030 spectrum of the NIST-Fab using 50% NUS at 900 MHz; (c) 1H,15N gHSQC E2N-8822-071 spectrum of the SSS using 50% NUS at 900 MHz; (d) Spectral overlay of the NIST-Fab, in red, of E2C-8822-030 with the SSS, in black, of E2N-8822-071 at 900 MHz. A 1H,15N spectral fingerprint was not measured for the NIST-Fab at 500 MHz because the 1H,15N gHSQC was too insensitive to measure the spectral map for the NIST-Fab at 15N natural isotopic abundance. All representative spectra were collected at 37 °C and are plotted just above the noise threshold. The extra peaks at 500 MHz between δH 11 ppm – 12 ppm are field dependent resonances whose intensity slowly decreases due to dynamics on the NMR time scale as the magnetic field increases from 500 MHz to 900 MHz; the frequencies of these field dependent resonances are the same regardless of the magnetic field. In spectrum E2C-8822-030, the observed vertical artifacts around 7 ppm arose from high amplitude noise that is intrinsic to the SOFAST-HMQC experiment. For a summary of experimental codes, see Table 1.
