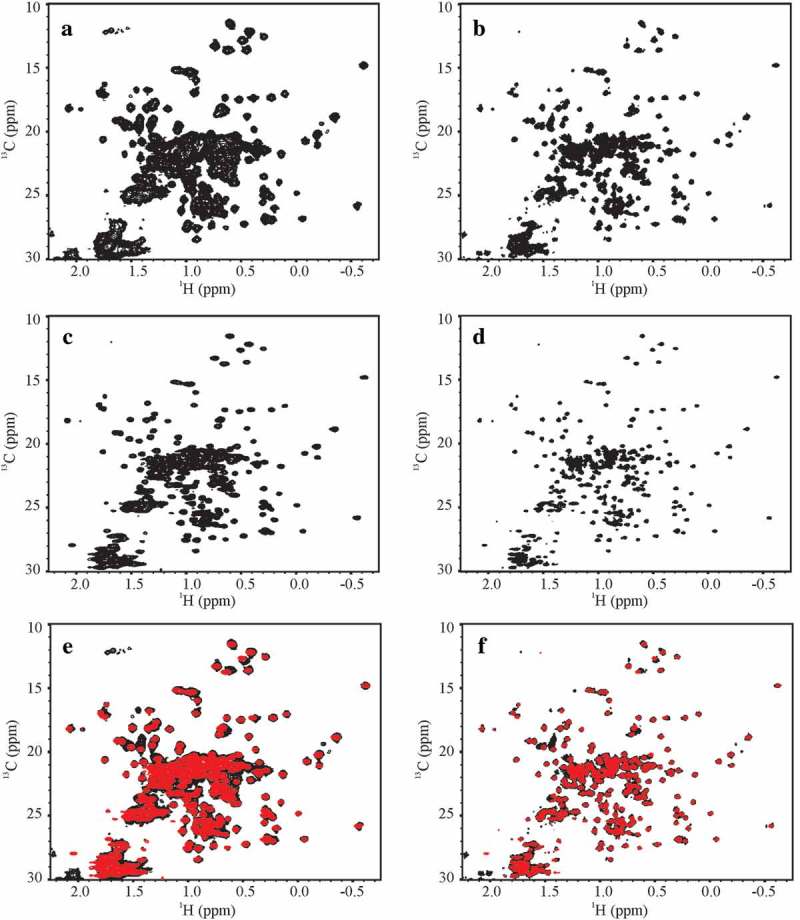
Figure 2.

Representative 1H, 13C gHSQC spectral fingerprints of the SSS and the NIST-Fab. (a) D2C-3897–012 spectrum of SSS at 500 MHz and (b) D2C-7425–012 spectrum of SSS at 900 MHz; (c) D3A-3897–015 spectrum of the NIST-Fab at 500 MHz and (d) D3A-7425–015 spectrum of the NIST-Fab at 900 MHz; and overlay of SSS, in black, and the NIST-Fab, in red, at (e) 500 MHz and (f) 900 MHz. All representative spectra were collected at 37 °C. For a summary of experimental codes, see Table 1.
