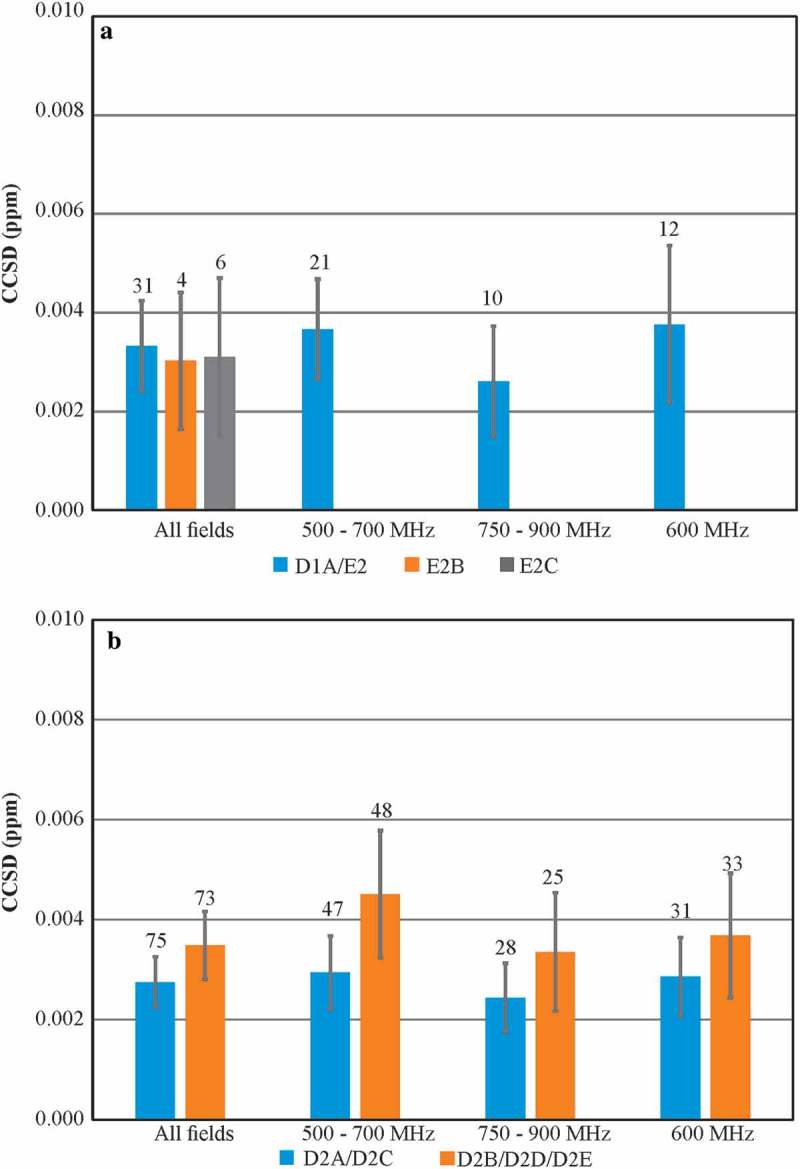
Figure 3.

Average Combined Chemical Shift Deviation (CCSD) precision plots of required experiments at 37 °C. (a) CCSD of 1H,15N D1A/E2, E2B, and E2C spectra; (b) CCSD of D2A/D2C and D2B/D2D/D2E 1H,13C spectra. All 1H,15N spectra and 1H,13C D2A/D2C spectra were acquired with uniform sampling, while 1H,13C D2B/D2D/D2E spectra were 50% non-uniformly sampled. The number above each bar represents the total number of spectra included in the analysis for each respective experimental type. For 1H,15N CCSD plot, E2 experiments were included since the only parameter change from D1A was a smaller 15N spectral width. Errors bars represent 95% confidence intervals of SEM. For detailed breakdown of experimental codes, see Table S10.
