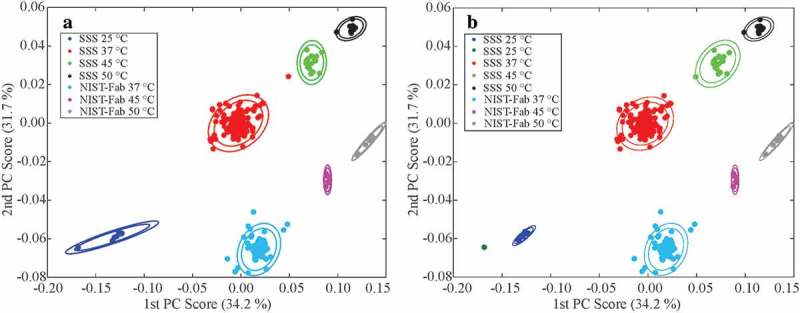
Figure 4.

Clustered PCA scatter plots of all peak lists from 354 1H,13C spectra. (a) Manually clustered plot according to reported sample-type and temperature. The centroid of each manual cluster was then determined. (b) Clustering output for k = 8 for both the Unweighted Pair Group Method with Arithmetic Mean (UPGMA) and mix-max group pair algorithms. The inner and outer ellipses represent 95% and 99% confidence regions, respectively, based upon chi-square probabilities. In panel b, both algorithms afforded the same spectral clusters, so only one plot is shown. See Figures S12 and S13 for different data clustering (k = 7 and 9) for the mix-max group pair and UPGMA algorithms, including a discussion of the chemometric classification of the outliers. For additional details on the outliers, see the main text and Figures S5 – S10.
