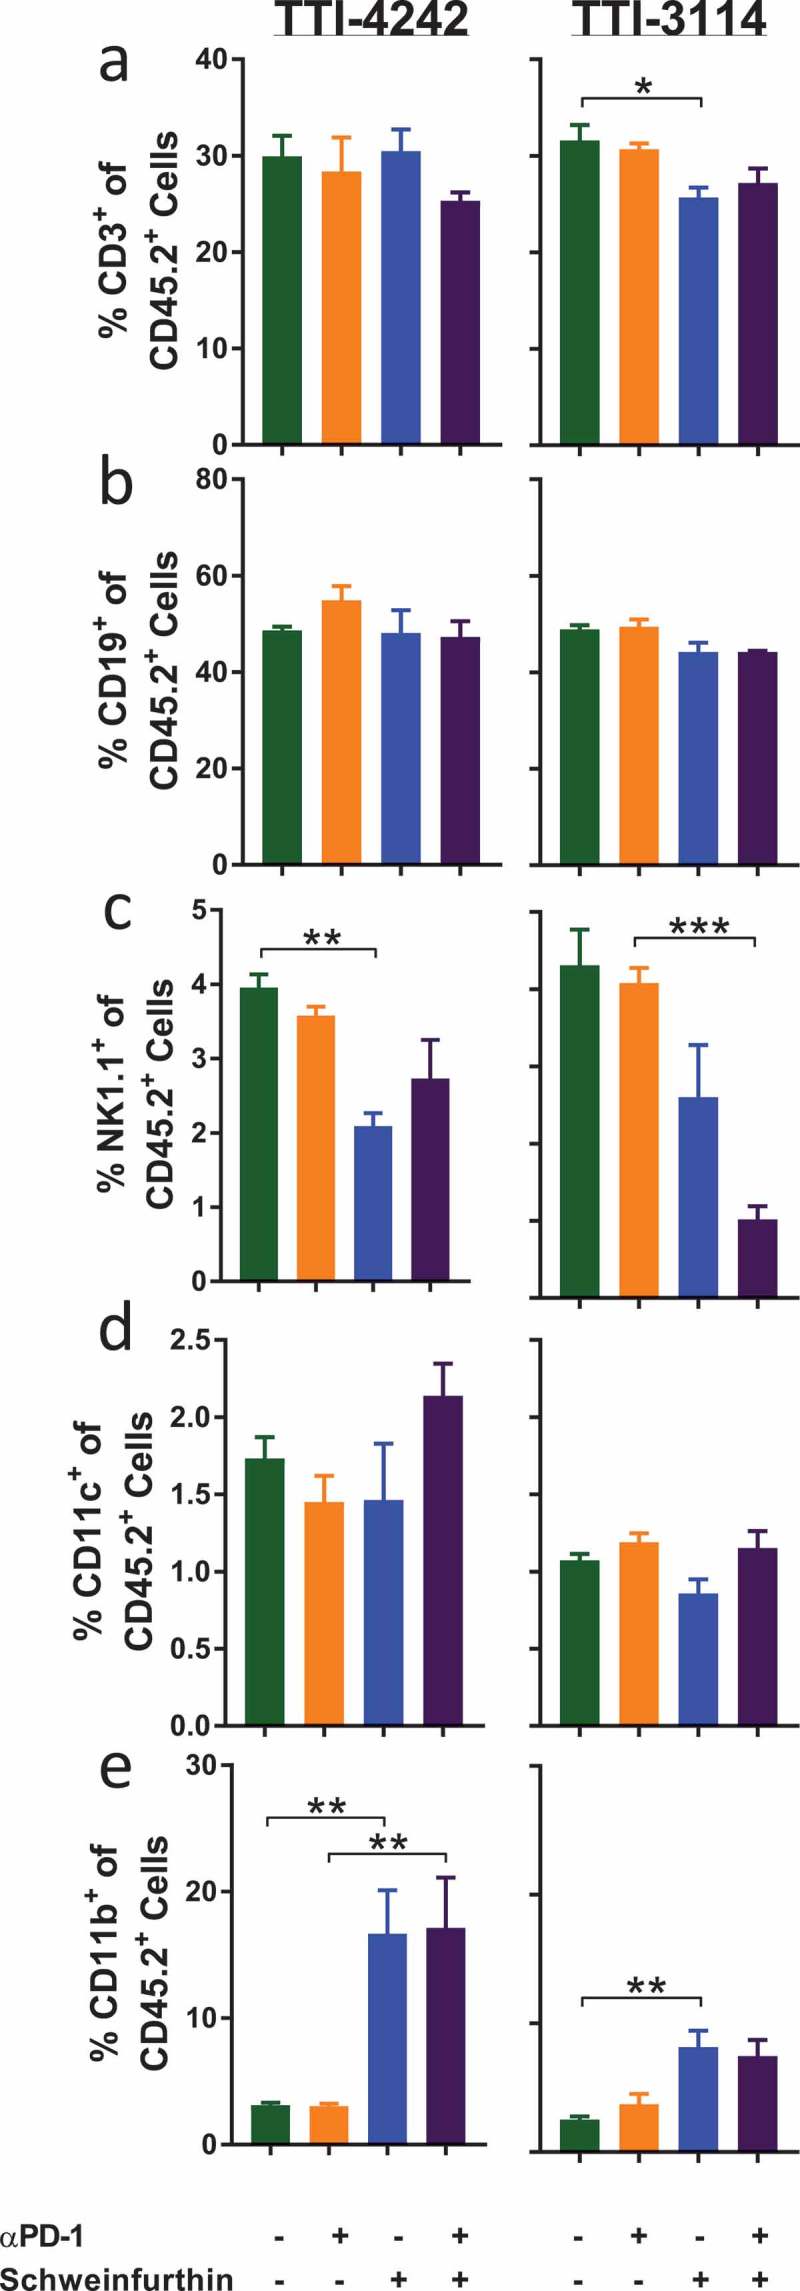
Figure 6.

Schweinfurthins skew splenic immune cell subsets. Mice were treated for 5 days according to the schedule in Figure 3(a). On day 6, spleens were harvested and processed for flow cytometry analysis. Samples were gated on CD45+ 7AAD− cells to show percentage of (a) CD3+, (b) CD19+ and (c) NK1.1+CD3− (d) CD11c+ cells and (e) CD11b+ cells. Data represent mean ± SEM; N = 3–5/group; p values determined by one way ANOVA with Tukey’s multiple comparisons post-test: * p < 0.05, ** p < 0.01, *** p < 0.001.
