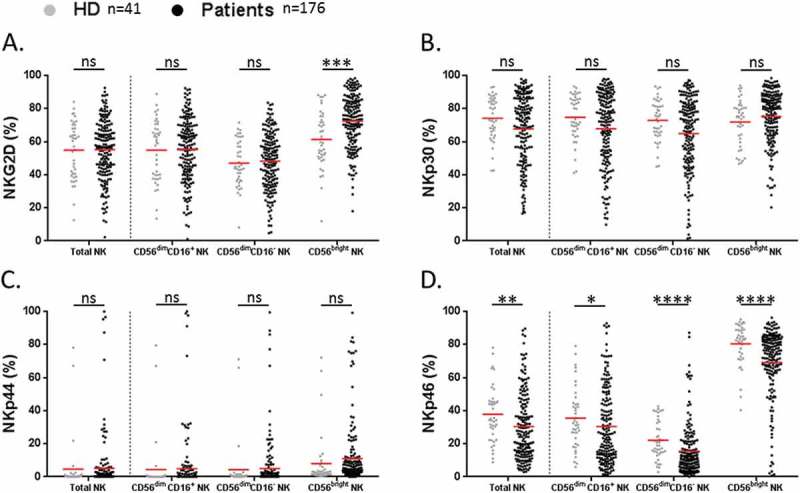
Figure 4.

Analysis of activating receptors on NK cell subsets in NSCLC patients.
Proportions of (A) NKG2D+, (B) NKp30+, (C) NKp44+ and (D) NKp46+ among total, CD56dim CD16+, CD56dim CD16− and CD56bright NK cell subsets in HD (grey n = 41) and NSCLC patients (black n = 176). Red bars represent the mean of each group. Statistical analysis were performed using the Mann-Whitney test (ns = not significant; * P < 0.05; ** P < 0.01; *** P < 0.001; **** P < 0.0001).
