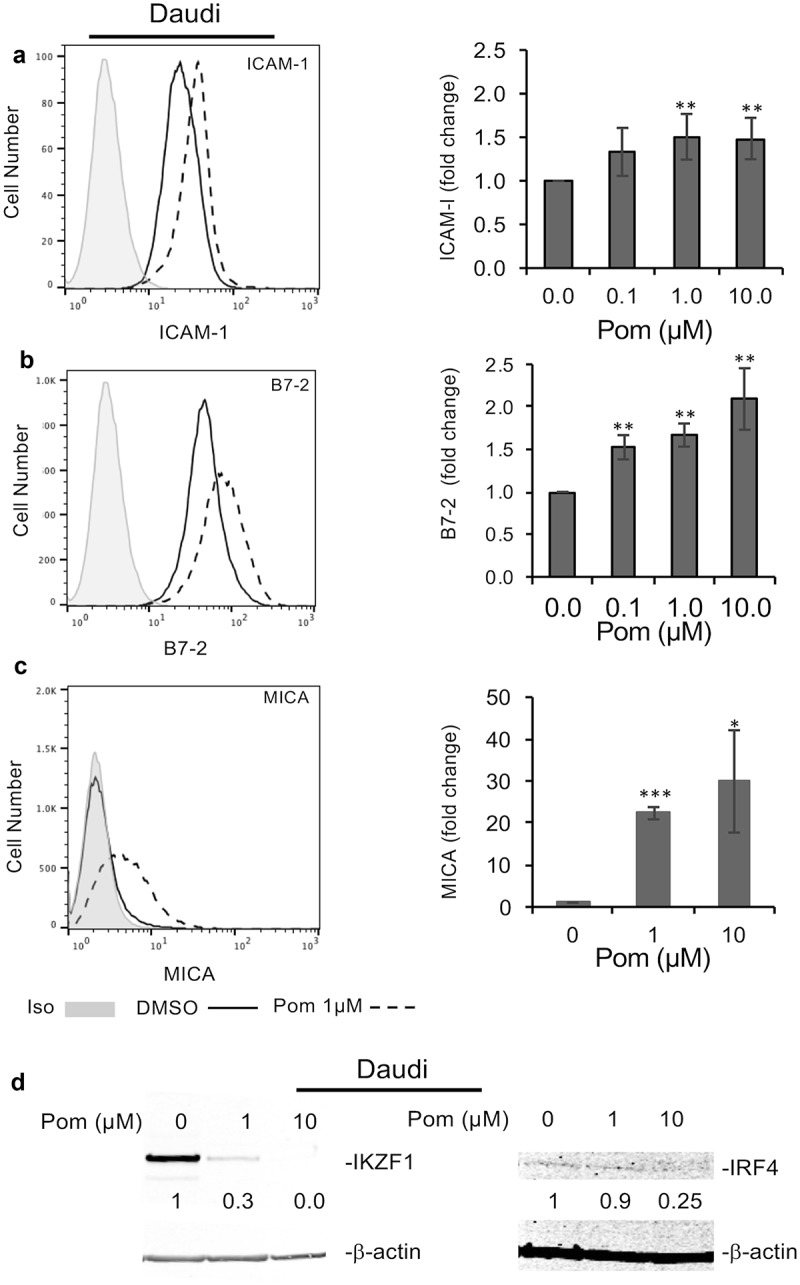
Figure 6.

Pom increases ICAM-1, B7-2, and MICA expression in EBV-infected Daudi cells. Daudi cells were treated for two days with DMSO control or Pom (0, 0.1 1, or 10 µM). Shown are representative histograms of each surface marker for (A) ICAM-1, (B) B7-2, and (C) MICA for cells treated with DMSO (solid line) or 1 µM Pom (dashed line). The isotype control is shown in grey. The average fold changes for these markers are shown in the bar graphs to the right. Shown on the graphs are the averages ± standard deviation from five independent experiments for ICAM-1 and B7-2, and three independent experiments for MICA. Asterisks indicate p values as follows compared to DMSO control: *p < 0.05, **p < 0.01, and ***p < 0.005. (D) Levels of IKZF1 and IRF4 in the nuclear extracts of cells treated for 2 days. β-Actin was measured as a loading control. The levels of IKZF1 and IRF4 relative to DMSO control are indicated under the blots and are relative to the DMSO treated control.
