
Figure 7.
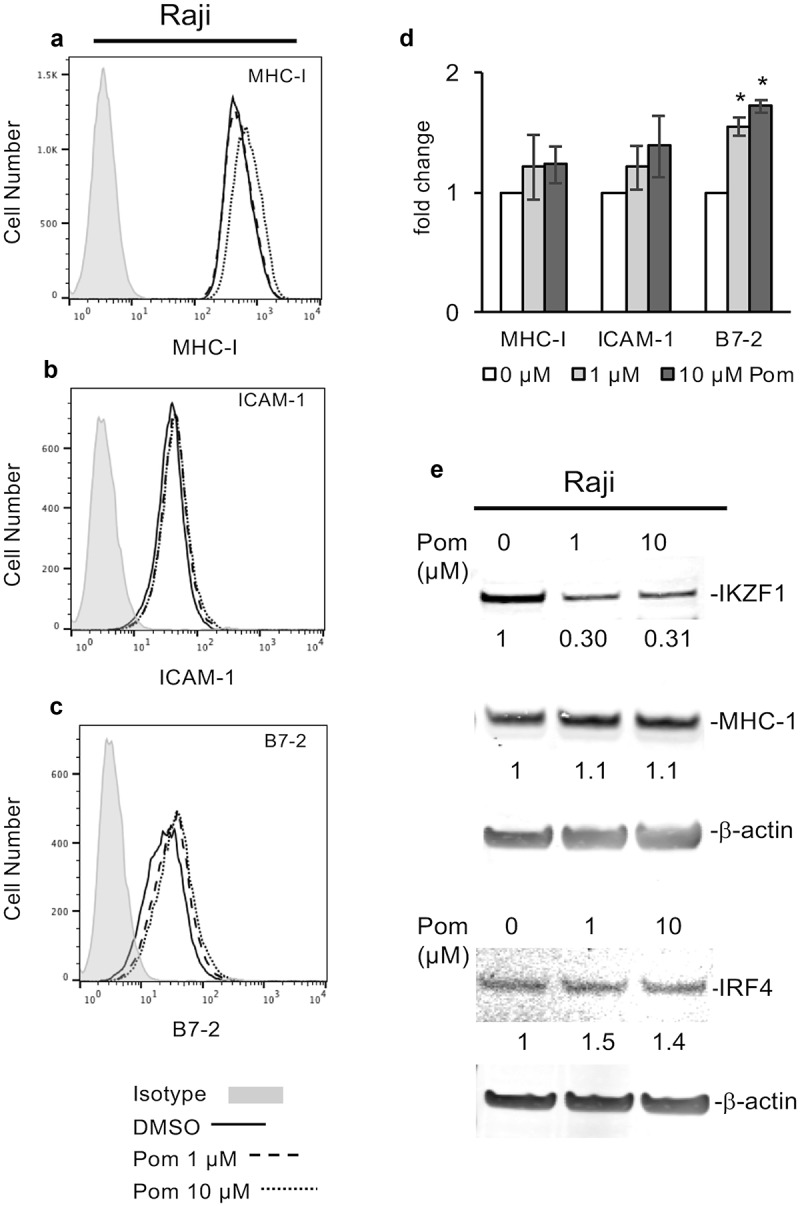
Effect of Pom on MHC-I, ICAM-1, and B7-2 surface expression in raji cells. (A-C) Raji cells were treated for two days with DMSO control or Pom (0, 1, or 10 µM). A representative surface expression histogram for (A) MHC-I, (B) ICAM-1, and (C) B7-2 is shown for DMSO (solid line), 1 µM Pom (dashed line), and 10 µM Pom (dotted line). The isotype control is shown in grey. (D) The average fold change in MHC-I, ICAM-1 and B7-2 expression. The data represents the averages ± standard deviations from three independent experiments. The asterisk indicates p < 0.05. (E) Nuclear and cytoplasmic extracts were prepared 2 days after treatment and analyzed for MHC-I (cytoplasmic) and IKZF1 and IRF4 (nuclear) expression. β-Actin was measured as a loading control. The levels of MHC-I, IKZF1 and IRF4 relative to the DMSO-treated control are indicated under the blots. Note the viability of Raji cells remained > 95% for all treatments.