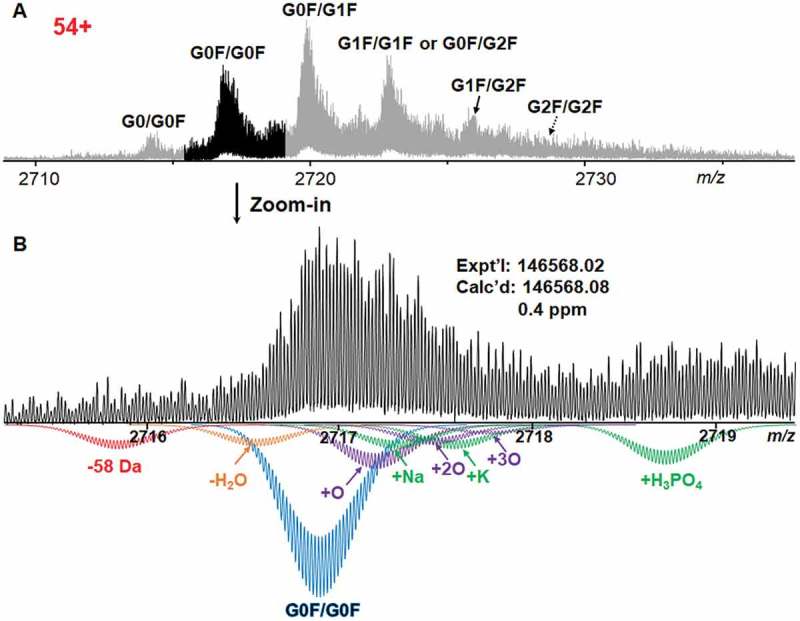
Figure 1.

Mass spectrum of intact IgG1 at the charge state of 54 + . A Mass spectrum showing six different glycoforms of IgG1, including G0/G0F, G0F/G0F, G0F/G1F, G1F/G1F or G0F/G2F, G1F/G2F, and G2F/G2F. B Zoomed-in experimental mass spectrum of G0F/G0F proteoforms at isotopic distribution with simulated isotopic distribution of G0F/G0F proteoforms. In addition to the primary G0F/G0F glycoform, loss of 58 Da, loss of water, multiple oxidized proteoforms, Na+ adduct, K+ adduct and phosphate adduct of the major glycoform were also simulated to match the experimental mass spectrum. GxF indicates N-oligosaccharides carrying x number of terminal galactoses.
