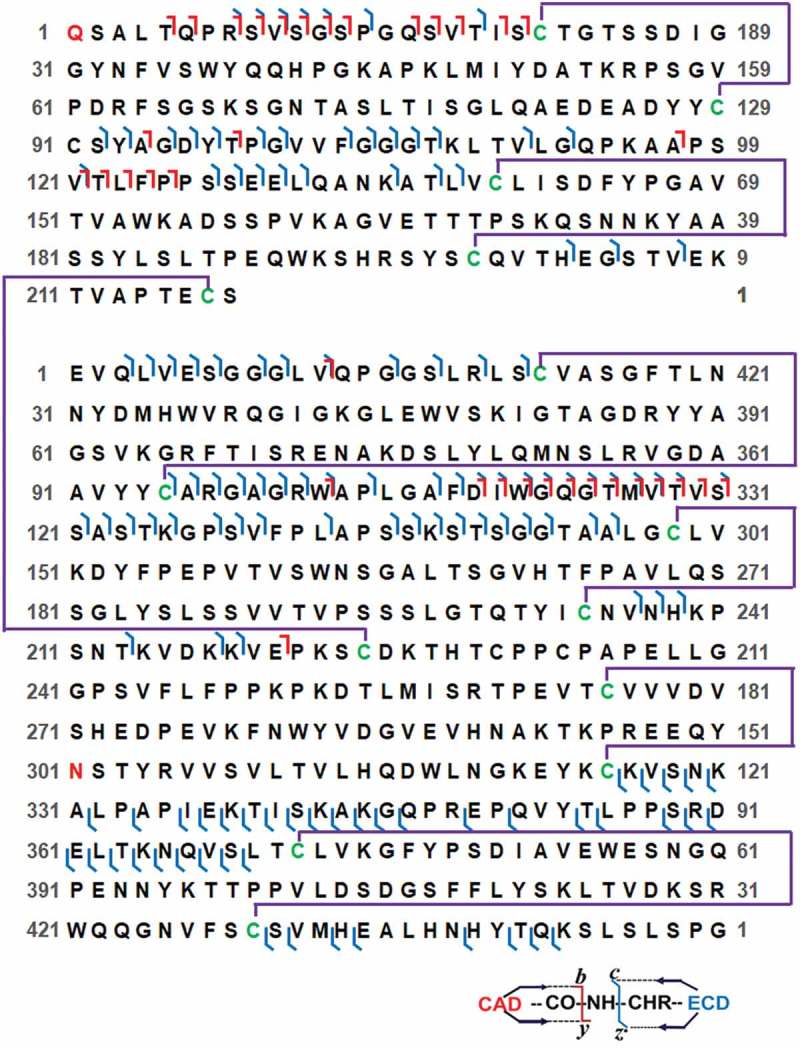
Figure 2.

Protein sequence map of intact IgG1 showing bond cleavages and disulfide bonds. Intact IgG1 at 51+ was isolated in a 50 m/z window for MS/MS analysis. The bond cleavages shown in protein sequence map are the results from combining two ECD and one CAD analysis. Intermolecular and intramolecular disulfide bonds are shown as purple lines. Cysteines connected by disulfide bonds are highlighted in green. The pyroglutamate on Lc and glycosylation site Asn301 on Hc are highlighted in red.
