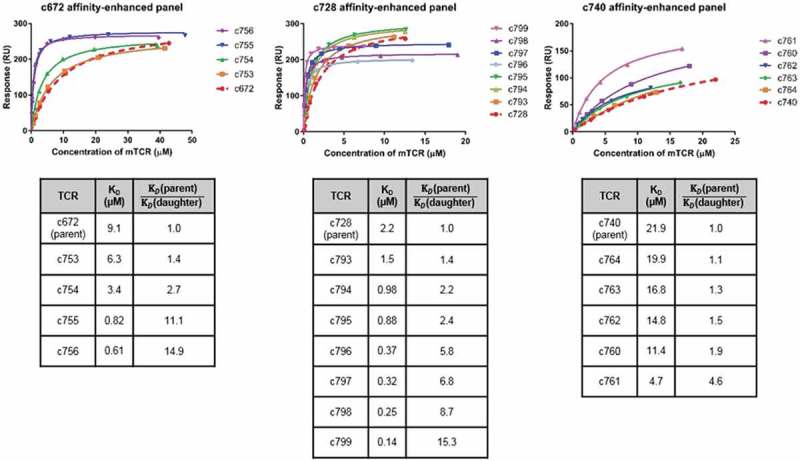
Figure 2.

Biochemical characterization of affinity-enhanced TCR panels arising from the parental TCRs c672, c728 and c740.
Comparison of SPR data for affinity-enhanced TCR panels arising from three parental TCRs for which raw SPR data is shown in Figure S1. Note that TCR c753 is a version of c672 with the α-chain reverted fully to germline sequence, and that c753 therefore acted as the template for the daughter mutants c754-c756. Binding affinity analysis of the MAGE-A10254-262-specific mutant TCR panels is illustrated in the upper panel, which shows the binding curve fits. KD values shown in the bottom panel were obtained by equilibrium binding or kinetic analysis. From the c728 panel, c796-c799 were tested in a separate SPR experiment to c728 and c793-c795, leading to the difference in maximum binding levels.
