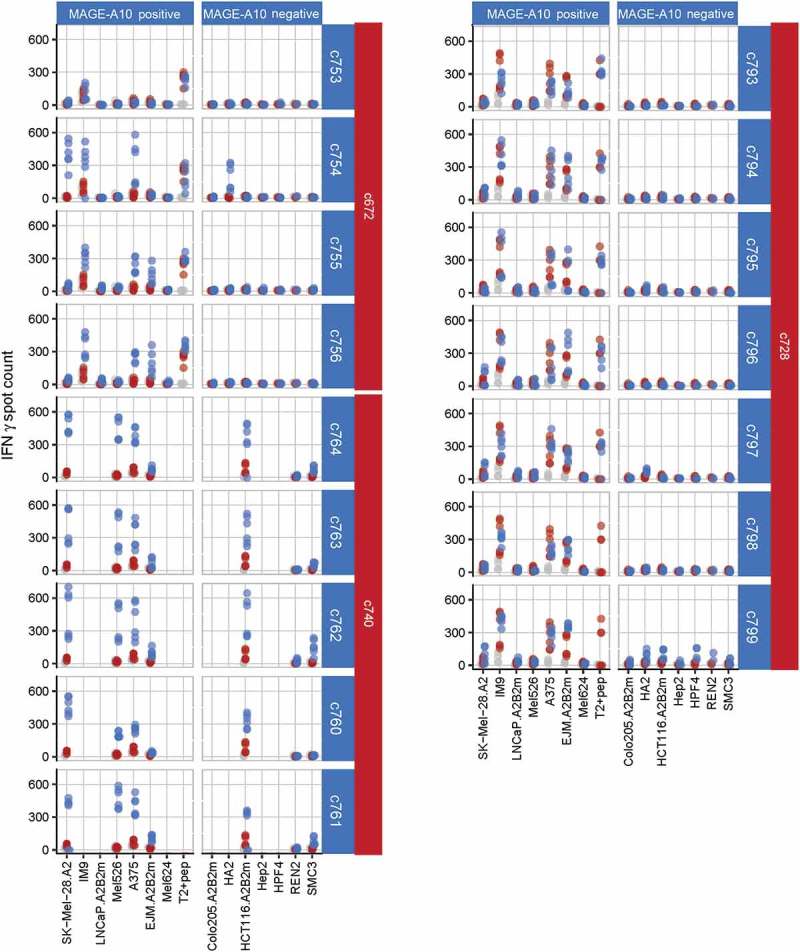
Figure 3.

Characterization of three affinity-enhanced TCR panels arising from the c672, c740 and c728 parental TCRs, using cellular assays.
The response of each affinity-enhanced TCR panel to MAGE-A10+ and MAGE-A10− target cell lines is shown, with daughter TCRs sorted in order of increasing affinity (top to bottom) for each parent. MAGE-A10+ cell lines are shown in order of increasing MAGE-A10 expression (left to right), as assessed by RT-qPCR. Red points represent average numbers of IFN-γ spot forming units (SFU) for T-cells obtained from two donors and transduced with each parental TCR, each measured in triplicate. Blue points represent the responses of T-cells transduced with the daughter TCR, while grey points represent the responses of non-transduced cells (consistently < 50 SFU).
