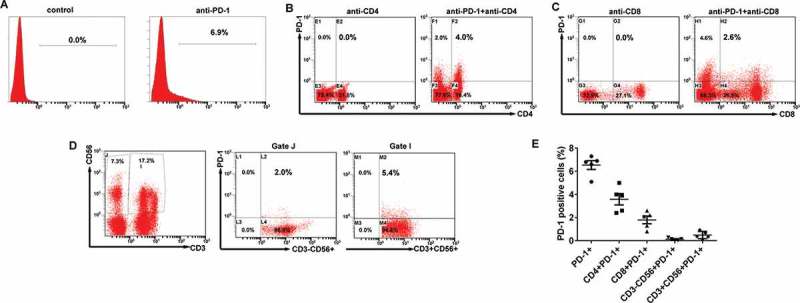
Figure 2.

PD-1 expression on the CIK cells. (A) The percentages of PD-1 positive cells among the populations of CIK cells. (B) The percentages of CD4+PD-1+ CIK cells. (C) The percentages of CD8+PD-1+ CIK cells. (D) The percentages of CD3−CD56+ PD-1+ and CD3+CD56+ PD-1+ CIK cells. (E) PD-1 expression on each subgroup of CIK cells in five EOC patients.
