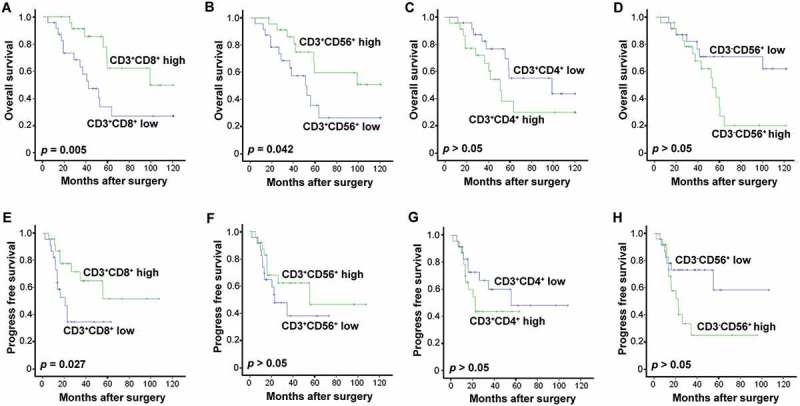
Figure 7.

Effects of CIK cell phenotype on survival in the patients. (A-D) Association of CIK cell phenotype and the patients' OS. (E-H) Association of CIK cell phenotype and the patients' PFS. The phenotype of the autologous CIK cells after culturing at day 14th from each patient was characterized by flow cytometry. The median of positive rate of CD3+ CD8+ (A, E), CD3+ CD56+ (B, F), CD3+ CD4+ (C, G), and CD3-CD56+ (D, H) cells was chosen as the cut-off point for separating low and high groups. The OS and PFS rates were evaluated by the Kaplan–Meier method and compared by the stratified log-rank test.
