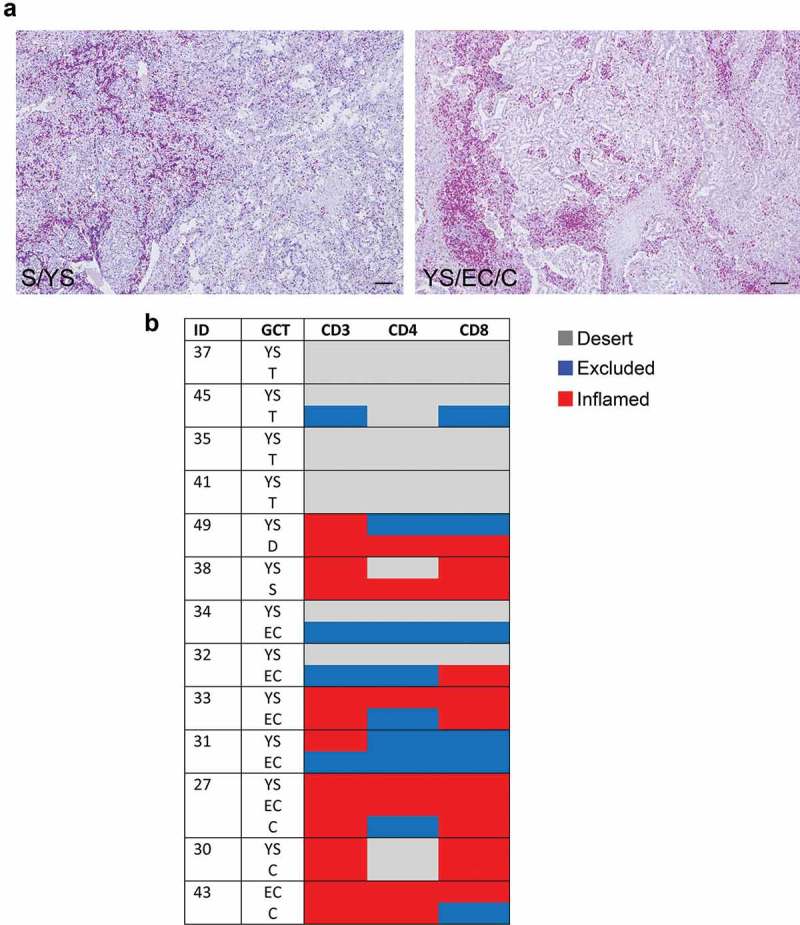
Figure 2.

Density of tumor-infiltrating CD3+ T cells in mixed meGCTs a, Representative IHC images for density of CD3+ T cells in primary mixed meGCT samples. CD3+ T cells (red) are differently distributed in mixed meGCT subtypes. Nuclei were counterstained with hematoxylin (blue). Original magnification, x10. Scale bar, 30 µm. b, Distribution of tumor-infiltrating CD3+ T cells in mixed meGCTs. The immune phenotypes are indicated as follows: immune inflamed, immune-excluded, and immune desert in red, blue and gray, respectively. S, seminoma; D, dysgerminoma; YS, yolk sac tumors; T, teratoma; EC, embryonal carcinoma; C, choriocarcinoma.
