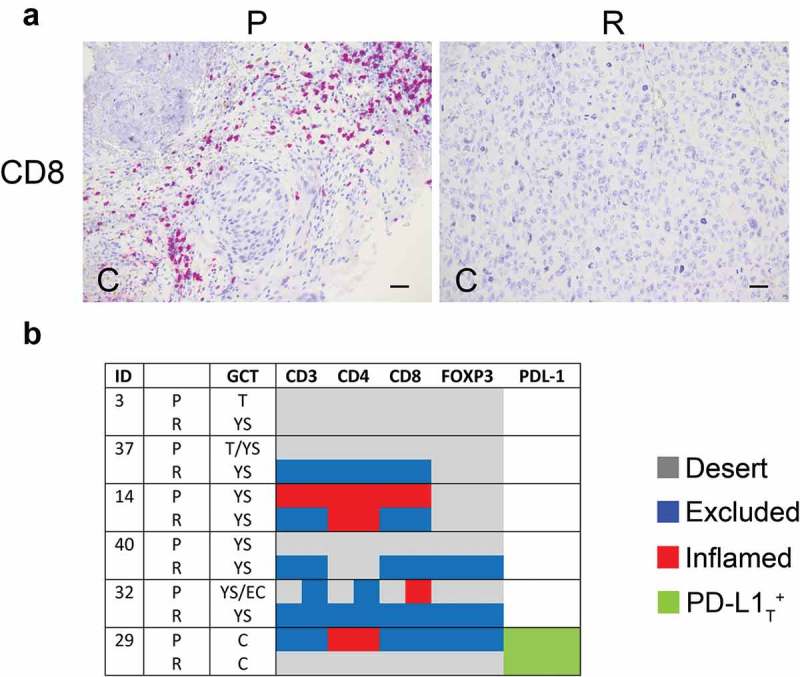
Figure 5.

Density of tumor-infiltrating T cell subsets and tumor PD-L1 in primary and relapsed meGCTs a, Representative IHC images of CD3+ T cell staining in primary (P) and relapsed (R) meGCT samples. Original magnification, x20. Scale bar, 30 µm. b, Distribution of TIL subsets and PD-L1 expression in primary and relapsed meGCTs. T, teratoma, YS, yolk sac tumors; EC, embryonal carcinoma; C, choriocarcinoma.
