
Figure 4.
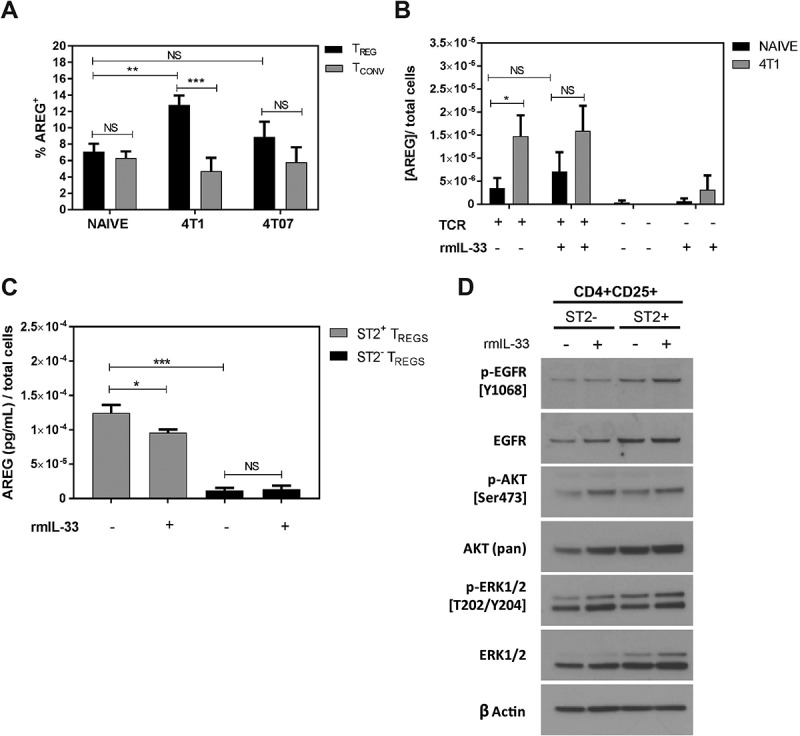
AREG expressing Tregs are increased in the lungs of 4T1 tumour-bearing mice relative to naïve mice. (a) Flow cytometry-based quantification of AREG+ Tregs and Tconvs from naïve and tumour-bearing mice show an increased percentage of AREG+ Tregs in the lungs of 4T1-bearing mice. Data are n = 7–10 mice per group. (b) Tregs were isolated from 4T1 tumour-bearing mice and stimulated with 10µg/mL αCD3, 2.5µg/mL αCD28 and 100U/mL rIL-2 (TCR) in the presence or absence of rmIL-33 (100ng/mL). AREG secretion was quantified by ELISA and shows the influence of TCR stimulation on AREG production. Data are from n = 6 mice per group. (c) Measurement of AREG secreted by ST2+ or ST2− Tregs cultured ± rmIL-33. Data are from three independent experiments performed in duplicate. All data analyzed using Student’s two-tailed t-test * p < 0.05, ** p ≤ 0.01, *** p ≤ 0.001. (d) Western blots showing the levels of total and phosphorylated EGFR, AKT, and ERK in ST2+ and ST2− Tregs cultured in the presence or absence of rmIL-33.