Figure 1.

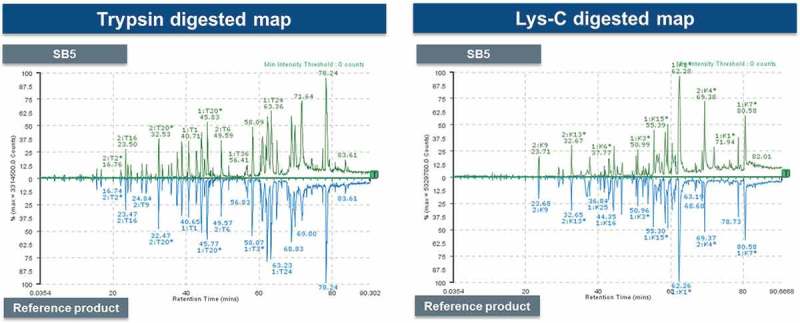
Comparison for peptide mapping profiles of the SB5 and the reference product.
Mirror images of Trypsin-digested (left) and Lys-C–digested (right) peptides profile of SB5 and the reference product.

Comparison for peptide mapping profiles of the SB5 and the reference product.
Mirror images of Trypsin-digested (left) and Lys-C–digested (right) peptides profile of SB5 and the reference product.