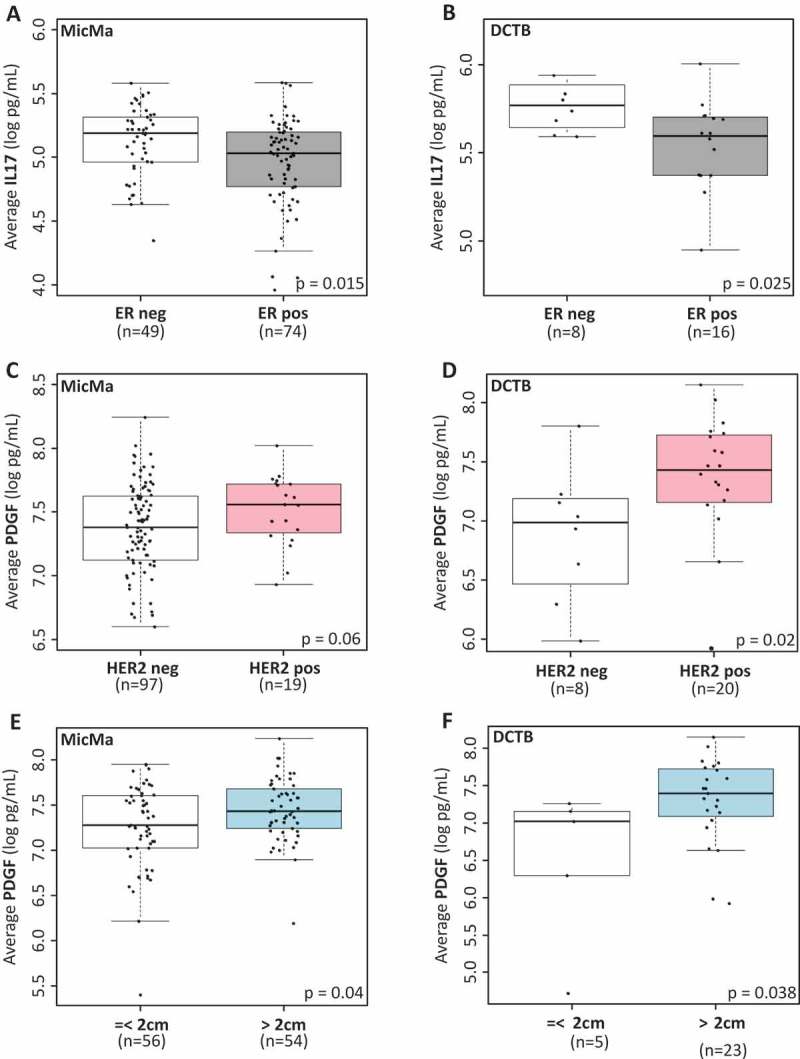
Figure 2.

Serum cytokine levels and clinicopathological parameters.
(A & B) Boxplots represent the average serum levels of IL17 (log pg/mL) in ER positive (ER pos, gray) and ER negative (ER neg, white) tumors in the MicMa (A) and DCTB (B) cohorts. IL17 levels are significantly higher in ER negative samples. (C & D) Average PDGF serum levels (log pg/mL) are visualized using boxplot in regard to HER2 status in the MicMa (C) and the DCTB (D) cohorts. White boxes, HER2 negative samples (HER2 neg), pink boxes HER2 positive samples (HER2 pos). (E & F) Boxplots represent the average serum levels of PDGF (log pg/mL) in small (< 2cm, white) or larger (> 2cm, blue) tumors in the MicMa (E) and DCTB (F) cohorts. PDGF levels are significantly higher in the serum of patient with bigger tumors. The size 2cm was chosen as a cutoff to reflect the TNM staging of the American Cancer Society. Mann-Whitney test p-values are denoted in the bottom right of each boxplot.
