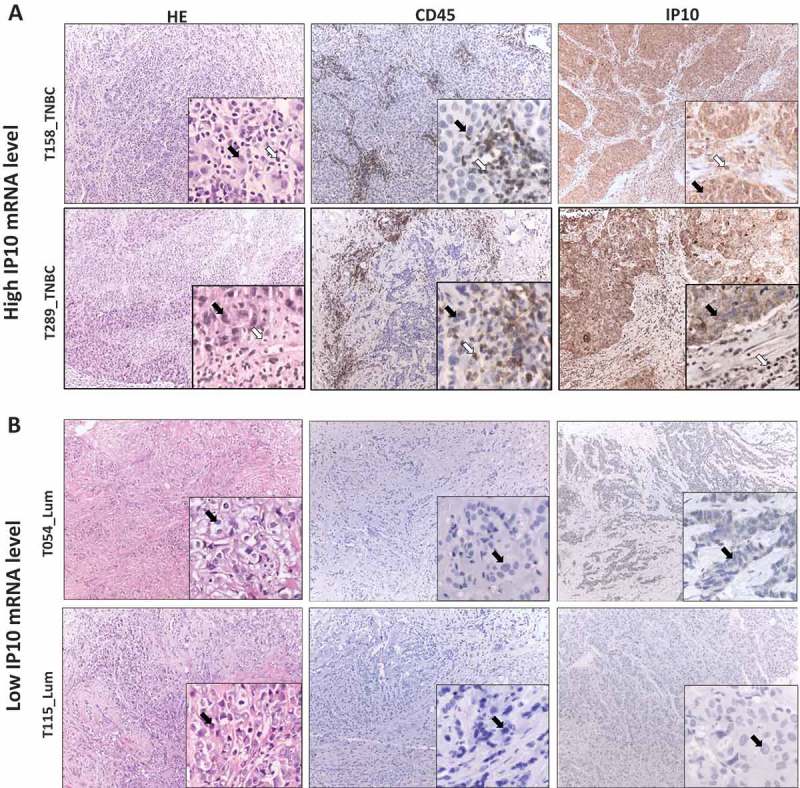
Figure 4.

IP10 protein expression in breast tumors associates with high and low IP10 mRNA.
The representative IHC images of tissue sections from two pairs of breast tumors exhibiting high (Panel A, T289 and T158) and low (Panel B, T115 and T054) mRNA levels of IP10. Left sections: hematoxylin and eosin (H&E) staining for histopathological topography examination of the selected FFPE breast tissue samples. Middle sections: IHC staining with anti-CD45 specific antibodies for evaluating tumor infiltrating lymphocytes. Right sections: IHC staining with of IP10 antibodies (see Materials and Methods for details). Black arrows show the tumor cells. White arrows show the TILs. The magnification is x10 for the whole section and x40 for the insertions.
