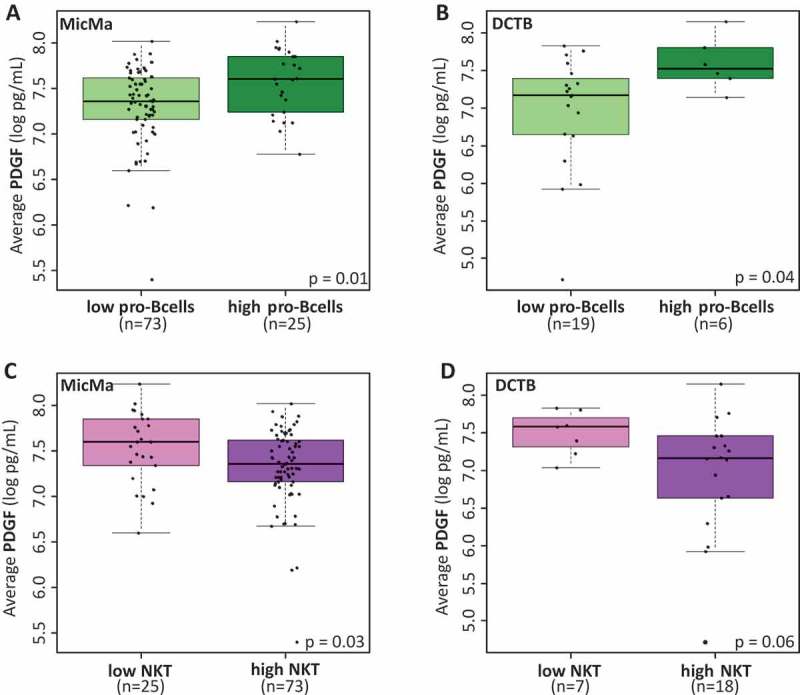
Figure 5.

Cytokine levels and infiltrating immune cells.
(A & B) Boxplots represent the average serum levels of PDGF (pg/mL) in respect to low or high (highest quartile) scores for pro-B cells infiltration at the tumor site in the MicMa (A) and DCTB (B) cohorts. PDGF levels are significantly higher in the serum of patient with higher pro-B cells scores. (C & D) Boxplots of serum PDGF levels according to low (lowest quartile) and high scores for natural killer T cells (NKT) infiltration at the tumor site in the MicMa (C) and DCTB (D) cohorts. Mann-Whitney test p-values are denoted in the bottom right of each boxplot.
