
Figure 4.
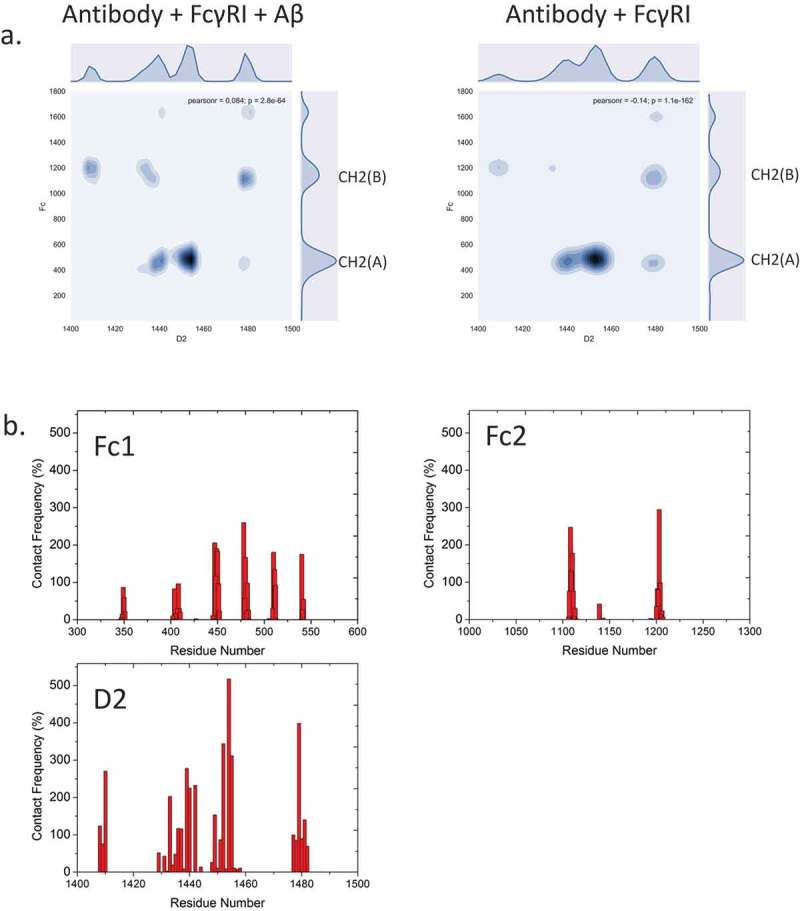
Fc-hFcγRI interactions and interfacial residues present asymmetric distributions of intermolecular contacts. a. 2D contact frequency map between antibody and Fc receptor D2 domain. b. contact frequency of residues from Fc1, Fc2, and hFcγRI D2 domain, respectively.