Figure 3.

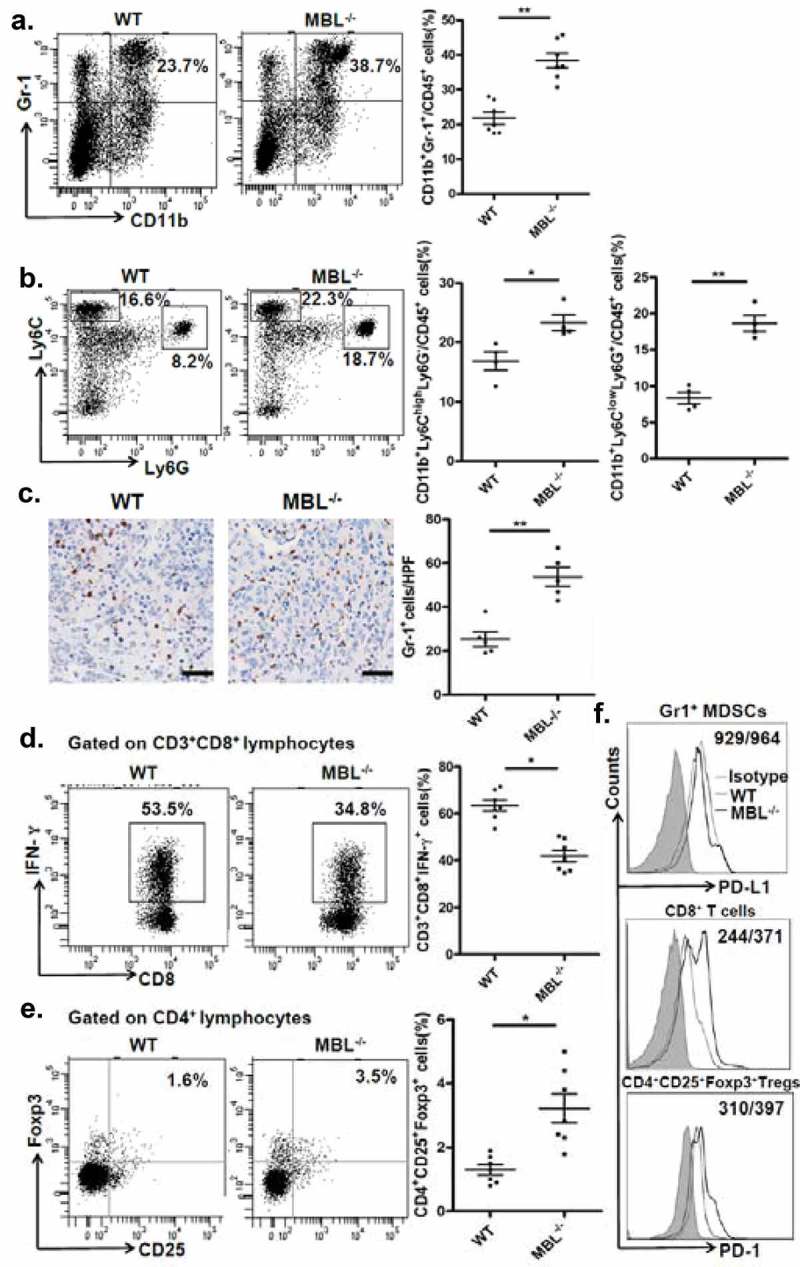
MBL deficiency causes elevation of MDSCs in tumor tissue.
Representative plots (left panel) and statistical analysis (right panel) of (a) MDSCs (CD11b+Gr-1+), (b) G-MDSCs (CD11b+Ly6ClowLy6G+) and M-MDSCs (CD11b+Ly6ChighLy6G−) frequency in tumor tissue of WT or MBL–/– mice were analyzed by flow cytometry. (c) Analysis of Gr-1 positive MDSCs in tumor tissues by immunohistochemistry (each dot represents the average of 10 HPFs). Scale bars, 50 μm. The percentages represent the cell frequency in CD45+ cells. The percentages of (d) IFN-γ+CD8+ cells gated on CD3+CD8+ T cells and (e) Tregs (CD25+Foxp3+ cells) frequency gated on CD4+ cell in tumor tissues of tumor-bearing mice were analyzed by flow cytometry. (f) Representative histogram showed immue-checkpoint molecule PD-L1 expression on MDSCs and PD-1 expression on CD3+CD8+ T cells and Tregs in tumor tissue of WT or MBL–/– mice. The numerical values represent the mean fluorescence intensity (MFI, WT/MBL–/–). Data are presented as means ± SEM (horizontal lines). *, P < 0.05; **, P < 0.01. The data representative of three independent experiments with similar results are shown.
