Figure 5.

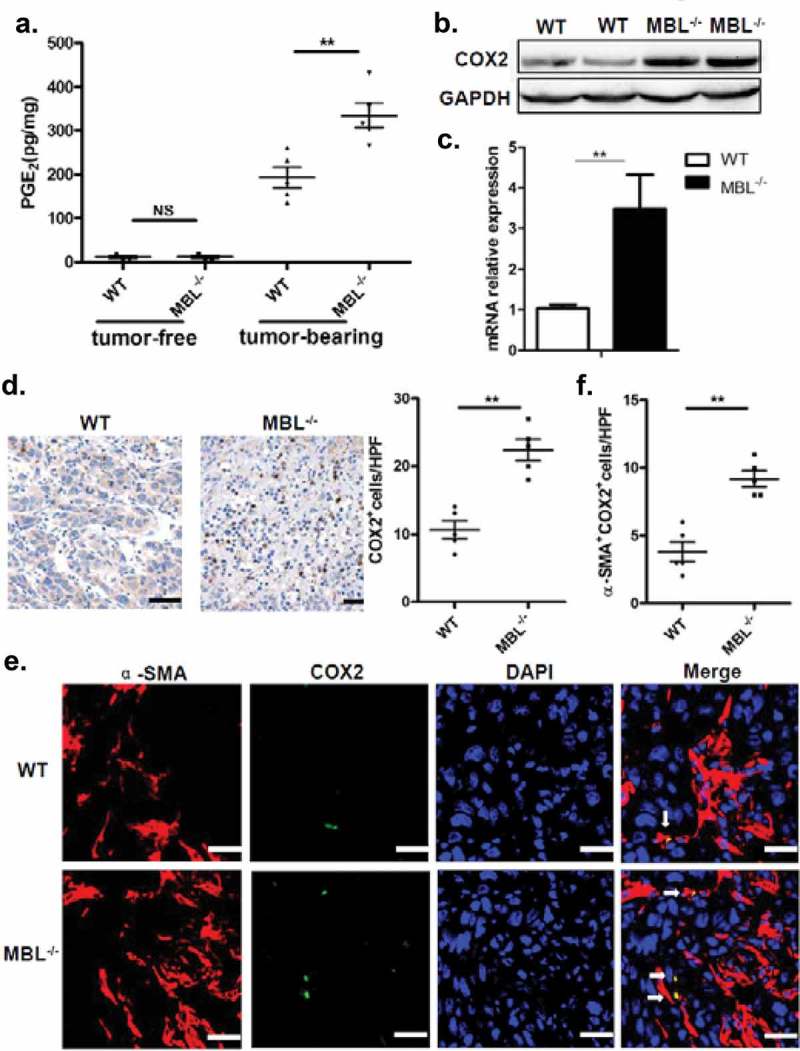
MBL deficiency correlates with elevated COX-2 expression and PGE2 production.
(a) The liver homogenate was collected to detect the PGE2 production by ELISA. COX-2 protein (b) and its mRNA expression (c) in tumor tissues were analyzed by immunoblotting and quantitative RT-PCR, respectively. (d) Analysis of COX-2 positive cells in tumor tissues by immunohistochemistry (each dot represents the average of 10 HPFs). (e) Immunofluorescence double staining of COX-2 (green) and α-SMA+ cells (red) and (f) quantification of α-SMA+ cells with COX-2 overexpression (white arrow) in tumor tissues of tumor-bearing mice. Nuclei were counterstained with DAPI (blue). Scale bars, 25 μm. Each dot represents the average percentages of cells indicated by arrow on 10 HPFs. Data are presented as means ± SEM (horizontal lines). *, P < 0.05; **, P < 0.01. The data representative of more than three independent experiments with similar results are shown.
