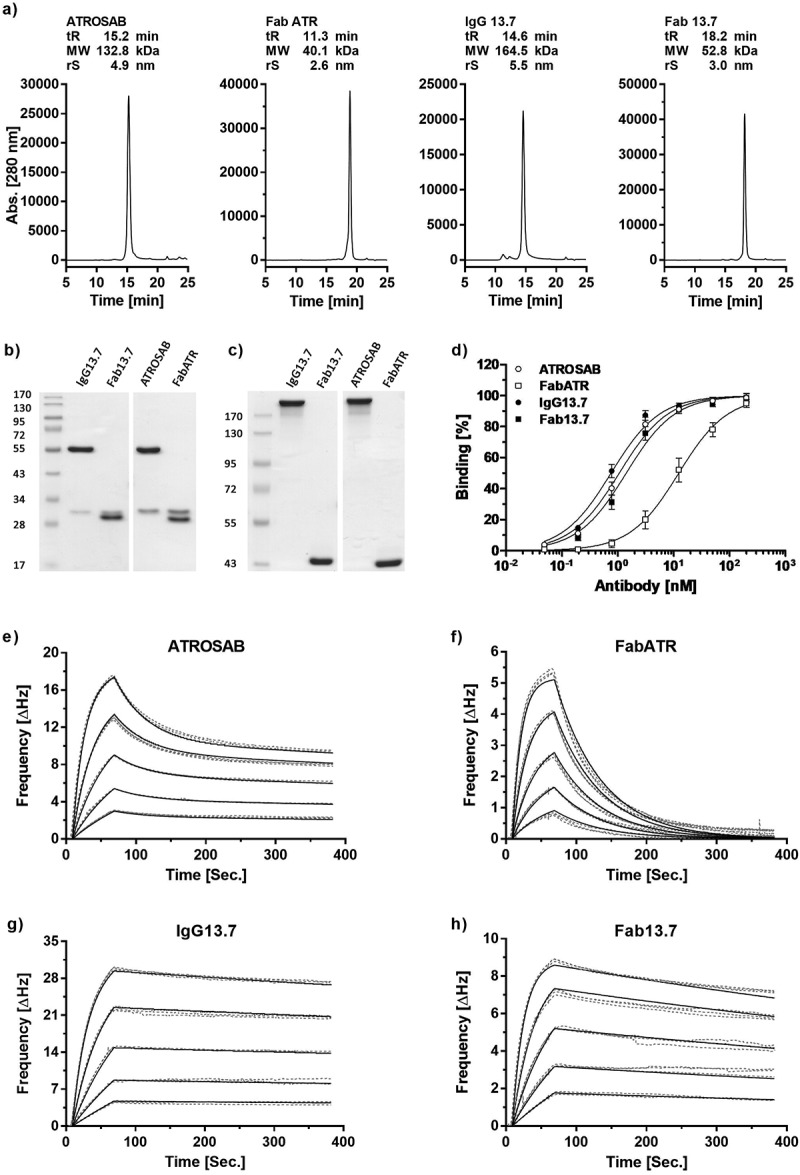
Figure 3.

Expression, purification and receptor binding of 13.7 derived IgG and Fab.
Purity and correct assembly were analyzed by analytical size exclusion chromatography (a, Yarra SEC-2000 column, flow rate 0.5 ml/min) and SDS-PAGE (b, 12% separation gel, reducing conditions; c, 8% separation gel, non-reducing conditions). The indicated molecular weights were interpolated using a standard curve of proteins with known mass and retention time. Binding to human TNFR1 was evaluated in ELISA (d, n = 3, mean ± SD) and QCM experiments (e-h). In QCM measurements, concentrations between 64 nM and 4 nM (ATROSAB and IgG13.7) or 128 nM to 8 nM (FabATR and Fab13.7), were analyzed in triplicates. Measurements (grey, dotted line) and fit (black, solid) are shown.
