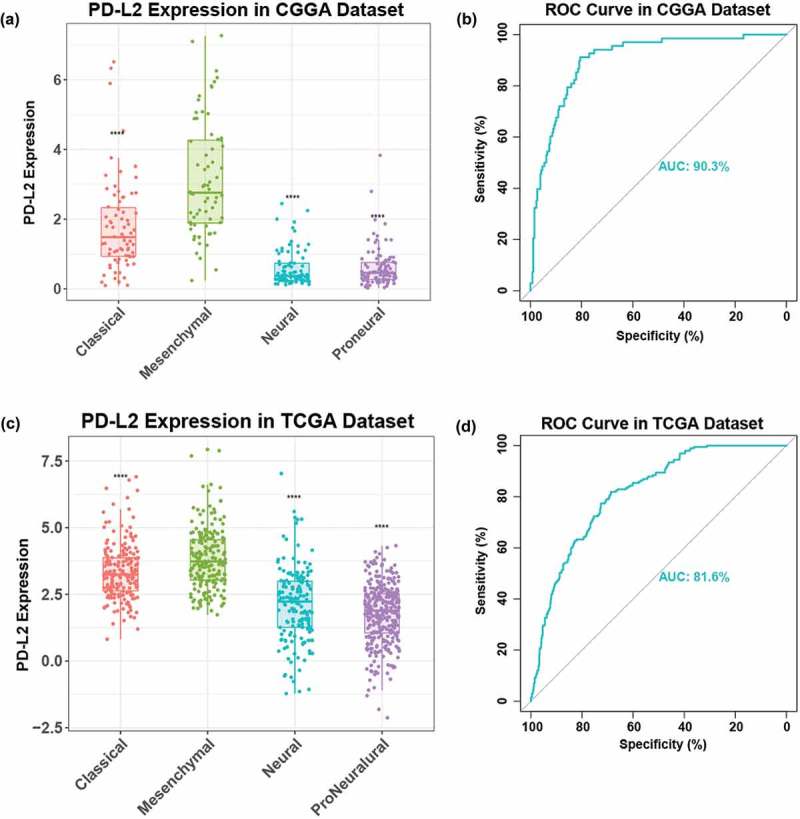
Figure 2.

Comparison of PD-L2 expression level in CGGA and TCGA cohorts with different TCGA molecular subtypes (a, c), PD-L2 was significantly increased in mesenchymal subtype (p < 0.0001). ROC curves exhibited highly sensitivity in predicting mesenchymal subtype (b, d). Receiver operating characteristic (ROC) curve for mesenchymal subtype prediction in CGGA and TCGA datasets. ROC curve analysis showed that PD-L2 had highly sensitivity and specificity to predict mesenchymal subtype in CGGA and TCGA database. Area under curve(AUC) was 0.903 and 0.816, respectively.
