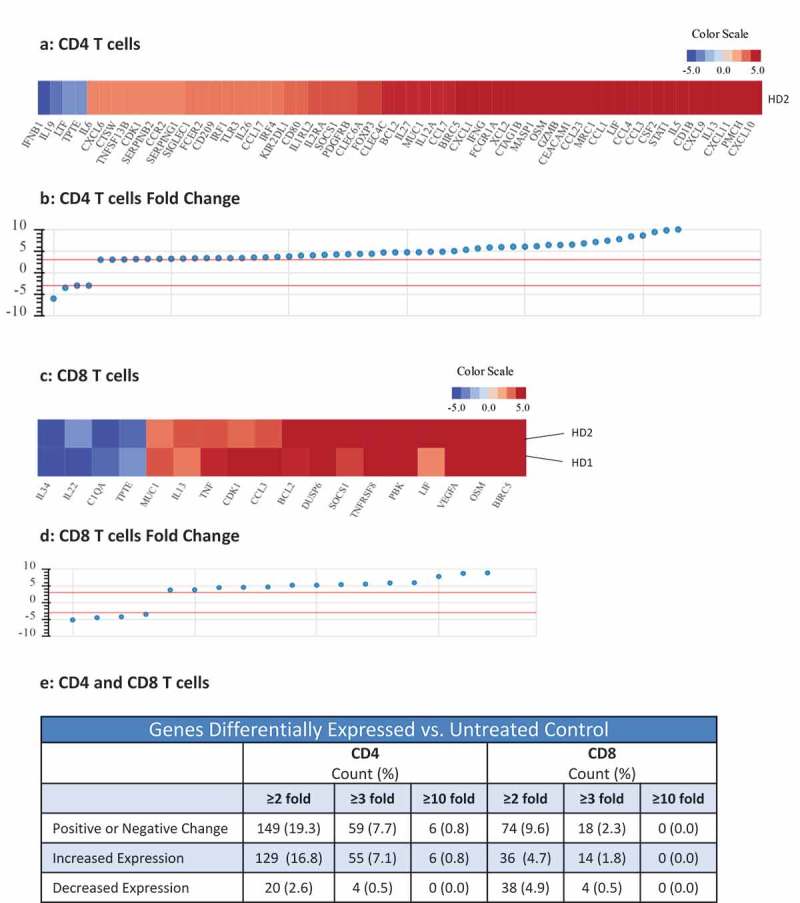
Figure 2.

Effects of N-809 treatment on CD4 and CD8 T cell gene expression. Healthy donor (HD) CD4 and CD8 T cells were incubated ±N-809 (37.5 ng/ml) for 24h prior to RNA isolation for RNASeq analysis using the NantOmics panel of immune related genes. (a, c) Heat maps depicting gene expression analysis for genes that were up- or downregulated ≥3-fold after N-809 treatment compared to no treatment, for CD4 (a, one donor) or CD8 (c, two donors) T cells. (b, d) Graphs depicting the fold change for the genes in a and c, respectively. (e) Table showing the number of genes differentially expressed in N-809 treated cells vs. the untreated control.
