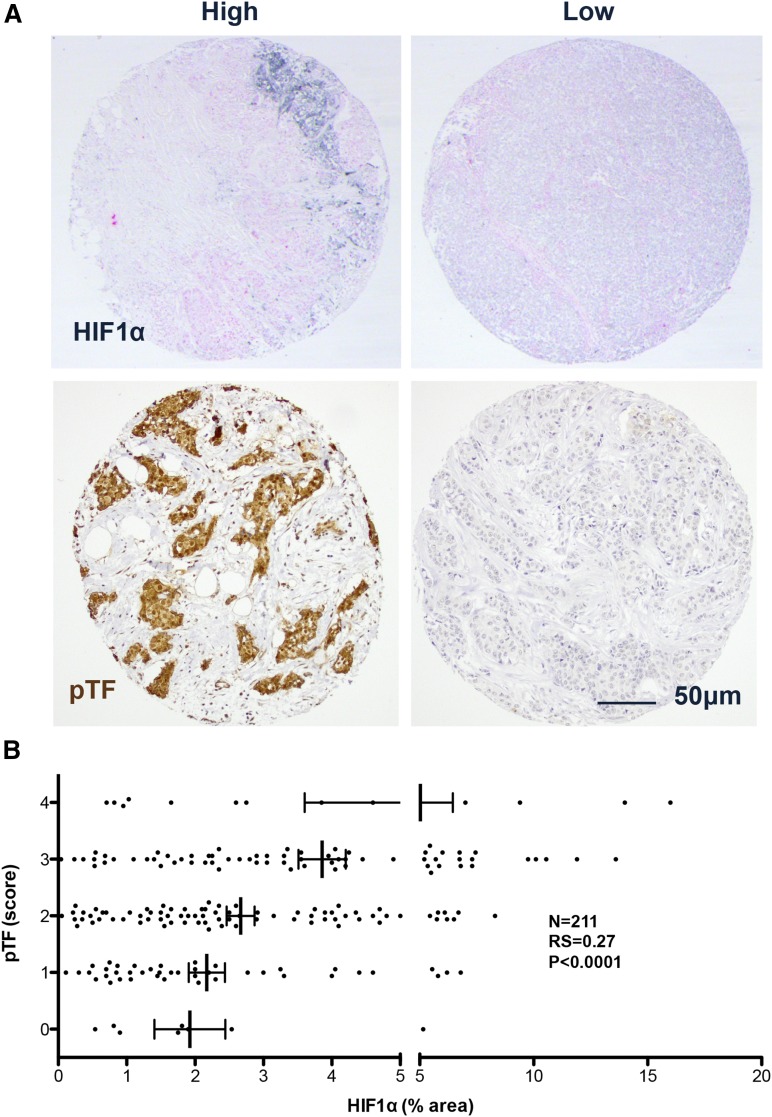
Figure 3.
Correlation between HIF1α and phosphorylated TF in human breast tumors. (A) Representative images of human breast tumor microarrays stained for HIF1α (black, upper panels) and phosphorylated TF (pTF, brown, lower panels). (B) Scatterplot of HIF1α level vs pTF score in human breast tumor microarrays (n = 211). Spearman’s correlation: RS = 0.27, P < .0001.

