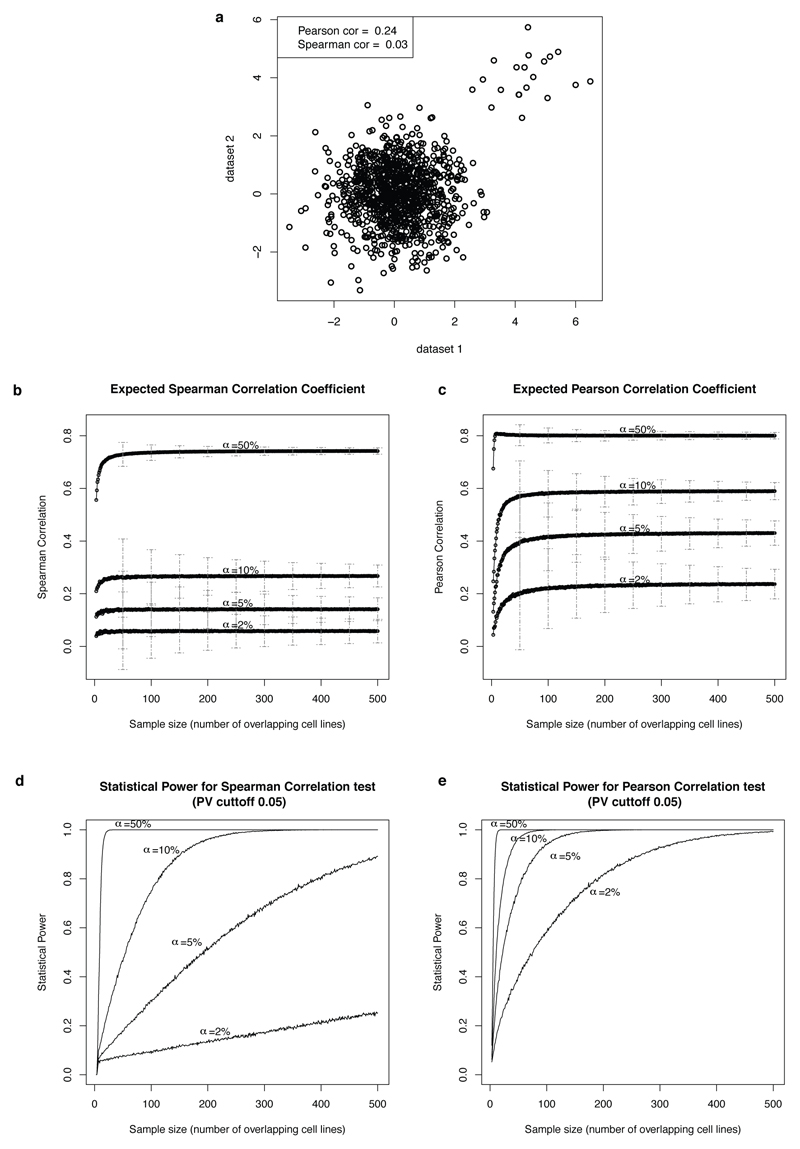
Extended Data Figure 2. Power Analysis of Spearman and Pearson correlation tests.
a, Example of a clear signal that appears in only 2% (20 out of 1000) data points using synthetic data. The Spearman statistic completely fails to detect such a signal which is typical for selective cancer therapeutics. b-c, Expected Spearman and Pearson correlation coefficients between the two datasets assuming different percentages of drug sensitive cell lines (alpha=2%,5%,10%, and 50%) and different number of overlapping cell lines. The error bars depict +/- one standard deviation. d-e, Estimated statistical power for Spearman and Pearson correlation tests using a P-Value cutoff of 0.05 for rejecting the null hypothesis. This analysis was done using synthetic data as described in the Methods section.

