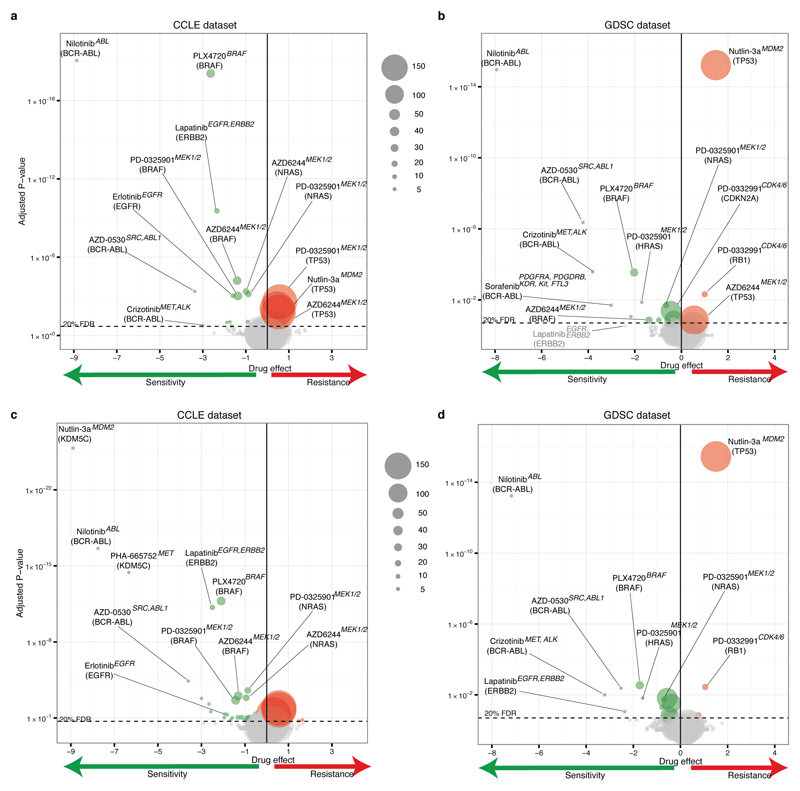
Extended Data Figure 4. Overlap in ANOVA genomic correlates of drug sensitivity.
Volcano plots showing analysis of variance (ANOVA) outcomes using drug responses from CCLE (left panels: a, c) or GDSC (right panels, b, d) dataset from overlapping set of cell lines, and mutational status of 71 cancer genes from the GDSC. a-b, Analyses using AUC values. c-d, Analyses using IC50 values. Points represent drug–gene interactions (with sizes proportional to the number of screened mutant cell lines). Positions on x-axis indicate effect size magnitudes: negative values (green circle) indicate mutations associated with increase in sensitivity, positive values (red circle) mutations associated with increased resistance. Positions on y-axis indicate association significances (corrected p-values) and the horizontal dashed line indicates a significance threshold (FDR 20%). Corresponding drug name, target(s) and cancer gene are reported for a subset of therapeutically relevant interactions.

