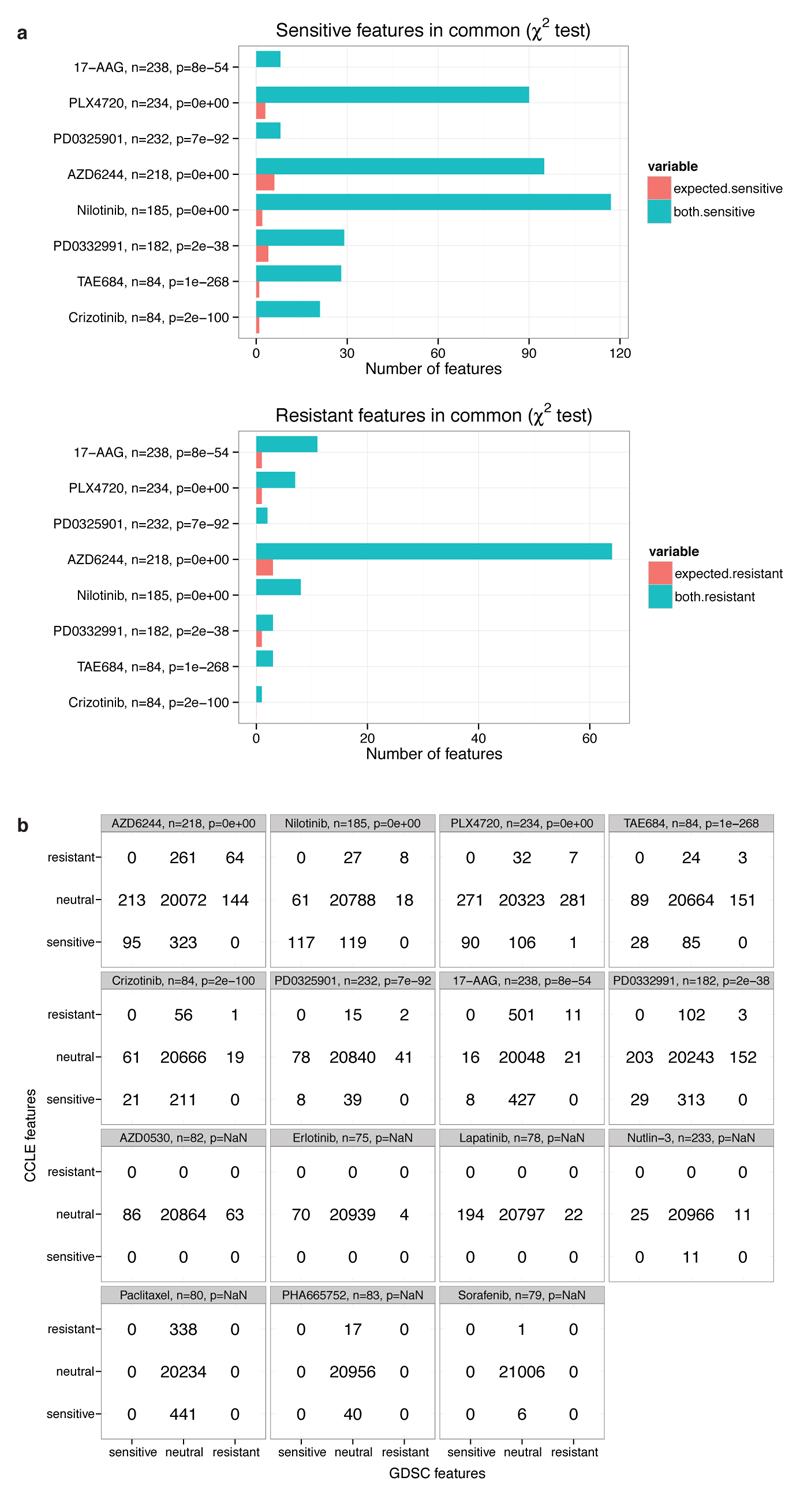
Extended Data Figure 6. Comparison of genomic features selected by Elastic Net between the CCLE and GDSC datasets.
a, consistency in predictors of response identified by elastic net regression across 21,013 genome features (copy number variations, mRNA expression and sequence variants). Statistical significance of the number of genomic features identified in common (χ2 test) using the GDSC and CCLE drug sensitivity datasets. Only drugs where features were found in both studies are represented. b, corresponding contingency tables. Out of the 4,957 drug/gene associations with nonzero elastic net weight coefficients, only one divergent result was found (weight coefficient with opposite signs) corresponding to a feature with the lowest possible frequency (nonzero coefficient in 1 out of 100 bootstrap trials in the elastic net analysis).

