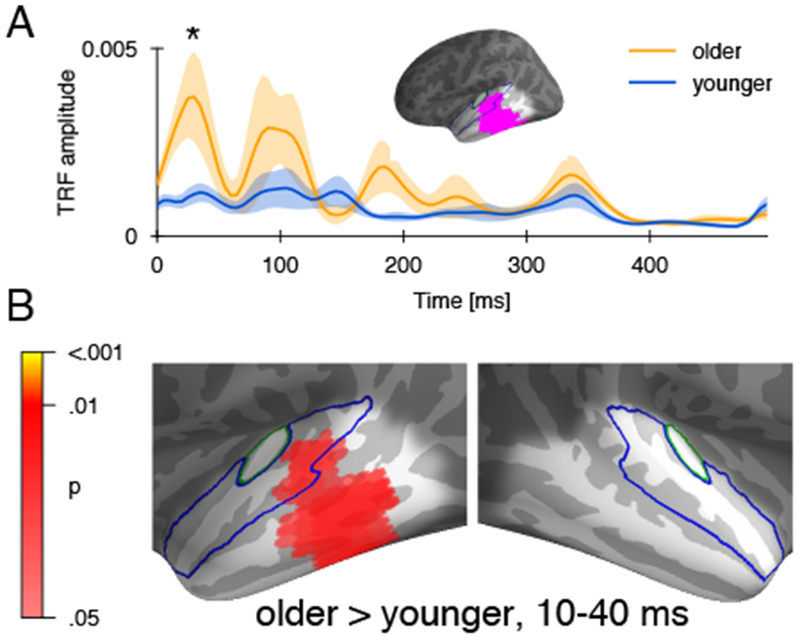
Figure 2:

Response function in the region of difference. A) Mean absolute response function in the ROI based on significant difference in model fit (cf. Figure 1), with standard error. Older adults had significantly higher amplitude in the earliest response peak. B) Anatomical distribution of the difference in the absolute response strength during the window defined based on the first peak (10-40 ms). The anatomical distribution closely resembles the region of the difference in model fit.
