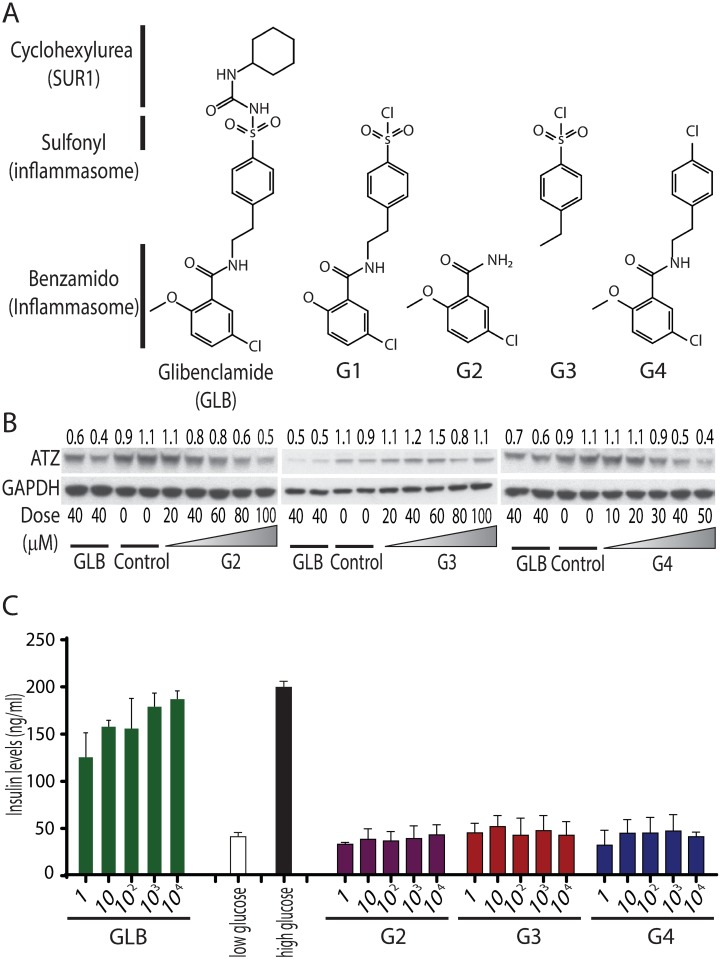
Fig 6. Effect of GLB analogs on ATZ levels and insulin secretion in mammalian cell line models.
(A) The structures of GLB and GLB analogs. (B) Western blotting analysis of the effect of G2, G3 and G4 on ATZ levels in HTO/Z cell line. GAPDH was included as a loading control. GLB at 40 μM was used as positive control; DMSO was used as negative control. (C) Insulin levels in Min-6 pancreatic β-cell line. The cells were incubated with GLB, G2, G3 and G4 in the indicated doses. Low and high glucose conditions were used as negative and positive controls (Mean ± SD, n = 3). The results show that insulin secretion is significantly increased by GLB at doses as low as 1 nM (p<0.0001) but not affected by analogs G2 (p = 0.8483), G3 (p = 0.9222) or G4 (p = 0.7886).

