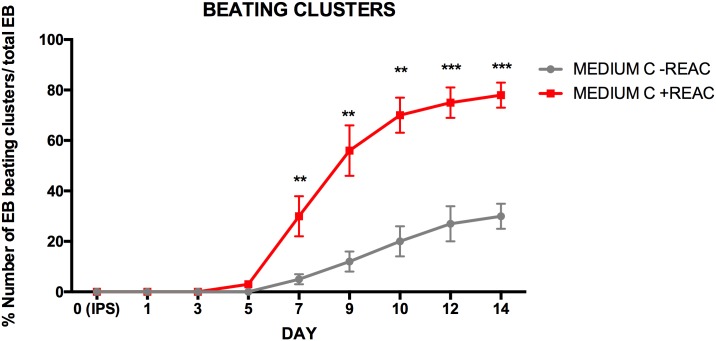
Fig 7. Analysis of the beating clusters.
The Figure shows the analysis of the yield of total spontaneously beating clusters obtained from hUiPSCs aggregated as EBs grown in cardiogenic conditioned medium in the absence (continuous grey line) or presence of REAC (continuous red line). Also shown is the percentage of beating clusters, assessed as the number of EBs that showed spontaneous contraction divided by the total number of EBs plated in cardiogenic conditioned medium in the absence (discontinuous grey line) or presence of REAC (discontinuous red line), and then assayed at the indicated time periods for the appearance of a contractile activity (mean ± SE; n = 4).

