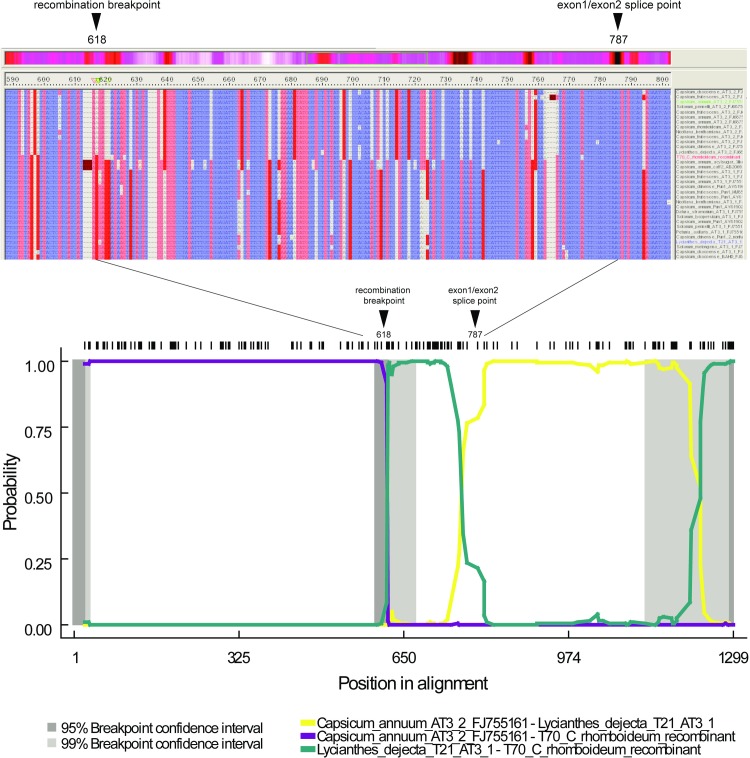
Fig 1. Diagram illustrating the recombination event between AT3-1 and AT3-2.
Upper plot shows a snapshot of a portion of aligned AT3-1 and AT3-2 showing the recombination breakpoint and exon1/exon2 splice boundary within the coding sequence alignment. The recombinant C. rhomboideum T70 sequence is in red lettering. The lower plot is a screen shot of the RDP4 pairwise similarity plot that depicts the pairwise identities among the recombinant and its putative parents. The black hash marks at the top of the plot indicate the positions of informative sites along the length of the alignment.

