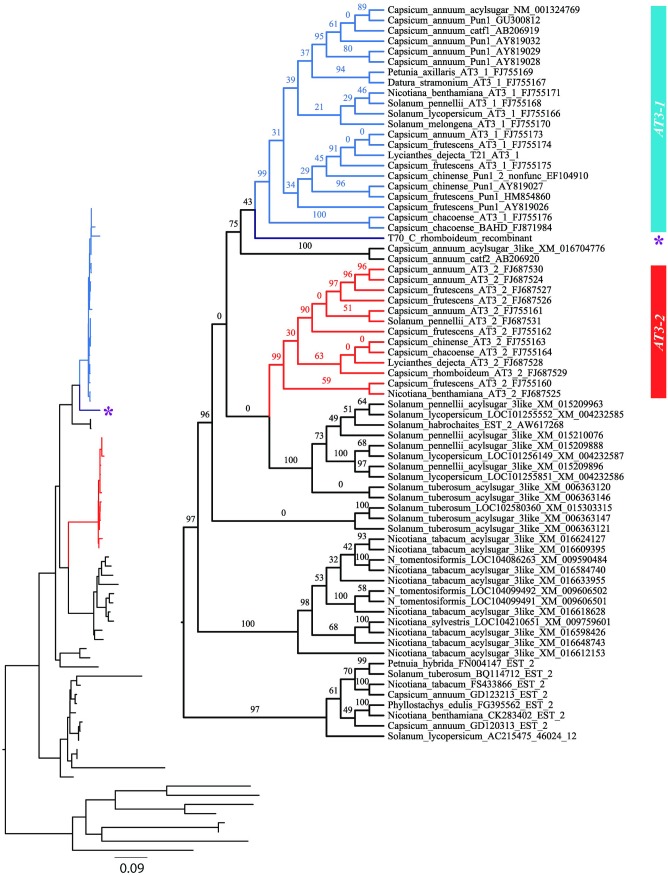
Fig 3. Maximum likelihood gene tree estimated from complete coding sequence alignment (ex1ex2) ignoring recombination.
AT3-1 branches are colored blue, AT3-2 are red, the T70 C. rhomboideum recombinant is purple and designated with a star. Numbers above branches are bootstrap support values for corresponding nodes. Inset shows branch lengths.

