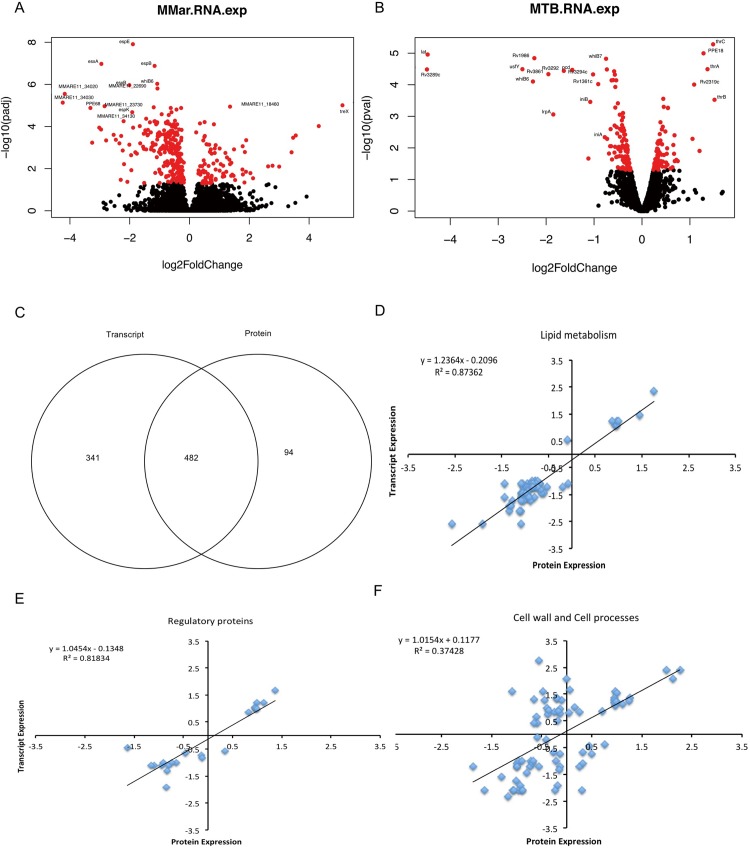
Fig 1. Global features of the transcriptomes and proteomes of the M. marinum and M. tuberculosis esx-1 mutant strains.
Volcano plots obtained from RNA-seq analysis of the wild-type M. marinum E11 strain vs. the eccCb1 transposon mutant (A) and of M. tuberculosis mc26020 vs. the esx-1 mutant strain (B). Each dot indicates the expression value of a gene. Red dots indicate statistical significance (q < 0.05), and black dots indicate a lack of statistical significance. Selected genes that are most down- or up-regulated in the esx-1 mutant strains are highlighted. (C) Venn diagram of the number of differentially expressed transcripts and proteins quantified of M. marinum eccCb1 mutant using RNA-seq and quantitative proteomics, respectively. Scatterplots of the relationship between differentially expressed genes of M. marinum eccCb1 transposon mutant and those of the isogenic wild-type strain E11, quantified in both data sets and classified into the following categories: (D) lipid metabolism, (E) regulatory proteins and (F) cell wall and cell process. Scatterplots and bar chart show the rectilinear equation and the Pearson correlation coefficient (R2).

