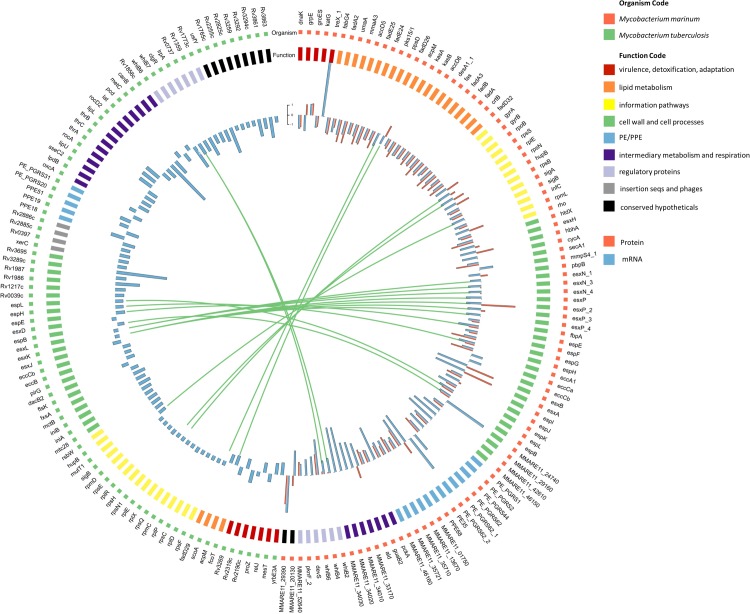
Fig 2. Top differentially expressed genes of M. marinum and M. tuberculosis, when grown in culture medium, grouped into broad functional categories.
Within each group, genes are ranked in ascending order by p-value. (Red) Top 100 annotated M. marinum E11 genes that exhibit greatest differential expression in the M. marinum eccCb1 transposon mutant compared to the isogenic wild-type strain E11 during growth in 7H9 culture medium. Bar chart of log2-fold change for individual genes (RNA, blue; protein, red; locus tags, outer). (Green) Top 100 annotated M. tuberculosis genes that exhibit greatest differential expression in the auxotrophic M. tuberculosis RD1 deletion mutant strain mc26030 compared to the isogenic control strain mc26020 during growth in 7H9 culture medium. Bar chart of log2-fold change for individual genes. The genes rv3872-rv3878 are not included as these genes are deleted in the RD1 mutant strain.

