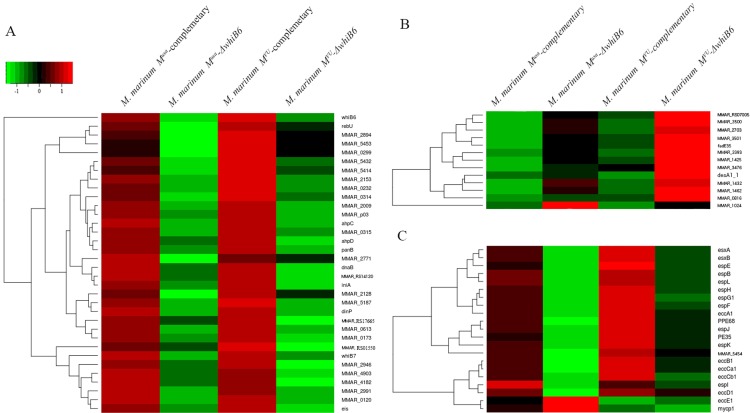
Fig 6. Gene expression profiles (Log2 Fold Change) of the complementary strains (M. marinum MUSA-complementary and M. marinum MVU-complementary) and knock-out strains (M. marinum MUSA -⊿whiB6 and M. marinum MVU-⊿whiB6) compared with those of the corresponding control strains (M. marinum MUSA-empty vector strain and M. marinum MVU-empty vector).
The red colour represents up-regulate genes and green colour represents down regulate genes compared with the control strains. The heat map of expression of the whiB6-activated gene set is shown in (A); Expression of the esx-1 locus is shown in (B); and (C) shows the WhiB6-repressed gene set.

