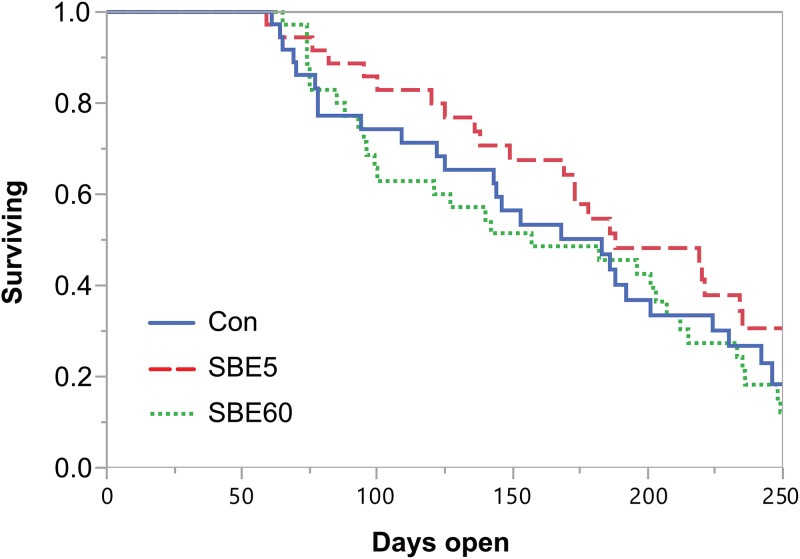
Fig 5. Survival plot for time to pregnancy through 250 DIM.
Data were right-censored at 250 d. There was no treatment effect on pregnancy risk (P = 0.35). The hazard ratios for treatment comparisons were as follows: 0.71 (95% CI: 0.40–1.25) for SBE5 vs. Con and 1.13 (95% CI: 0.67–1.92) for SBE60 vs. Con.

