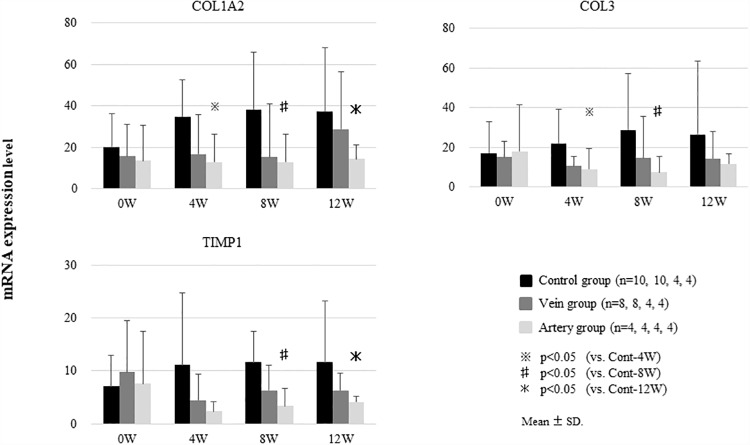
Fig 6. Expression of liver fibrosis-related genes after the induction of liver fibrosis and BMSC treatment.
After the induction of liver fibrosis, canines were treated with BMSCs via the peripheral vein (Vein group) or hepatic artery (Artery group). The expression of COL1A2, COL3, and TIMP-1 mRNA tended to decrease in the Vein group compared to that the Control group, although the differences were not significant. In the Artery group, the expression levels of COL1A2, COL3, and TIMP-1 were significantly lower than those in the Control group at 4, 8, and 12 weeks. Data show the mean ± standard deviation.

