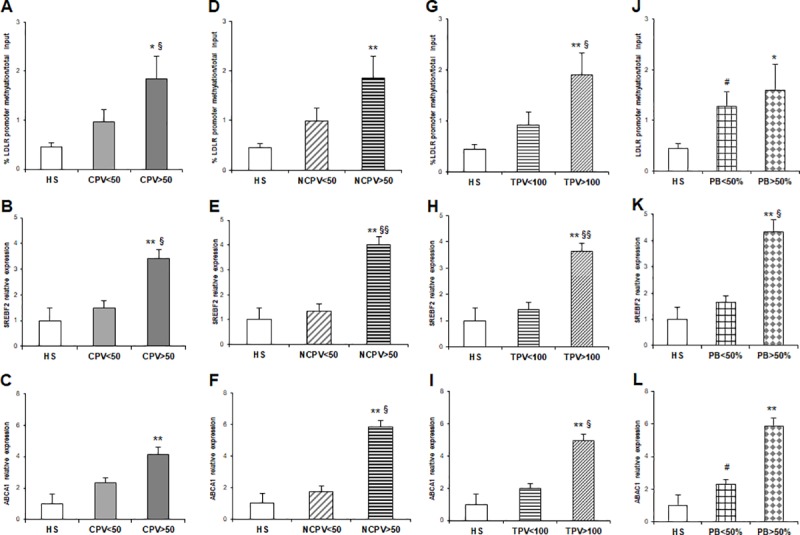
Fig 5.

(A) % of LDLR promoter methylation/total input in CHD patients with CPV<50 (n = 35) and CPV>50 (n = 30) compared to HS (n = 30); (B-C) SREBF2 and ABCA1 mRNA relative expression in CHD patients with CPV<50 and CPV>50 vs HS; (D) % of LDLR promoter methylation/total input in CHD patients with NCPV<50 (n = 36) and NCPV>50 (n = 29) compared to HS (n = 30); (E-F) SREBF2 and ABCA1 mRNA relative expression in CHD patients with NCPV<50 and NCPV>50 vs HS; (G) % of LDLR promoter methylation/total input in CHD patients with TPV<100 (n = 35) and TPV>100 (n = 30) compared to HS (n = 30); (H-I) SREBF2 and ABCA1 mRNA relative expression in CHD patients with TPV<100and TPV>100 vs HS; (K-L) SREBF2 and ABCA1 mRNA relative expression in CAD patients with PB<50% (n = 46) and PB>50% (n = 19) vs HS (§p value<0.05 vs PB<50); (*p value<0.05 vs HS; **p value<0.01 vs HS for all comparisons).
