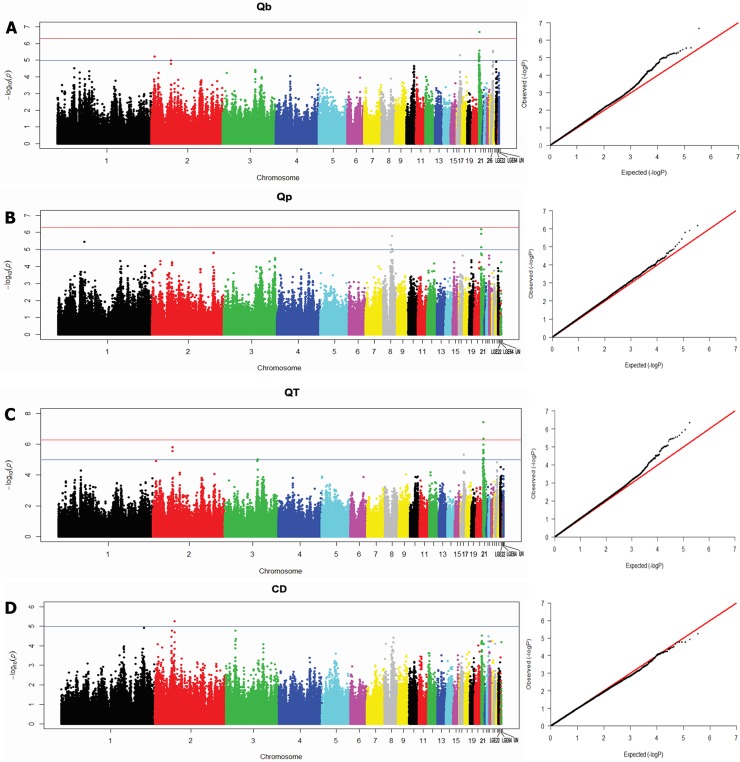
Fig 1.
Manhattan plot (left) and quantile-quantile plot (right) of the observed P-values for QB (A), QP (B), QT (C) and CD (D). In Manhattan plot, the red and gray horizontal lines indicate the genome-wise significance threshold [-log10 (5.135E-07)] and suggestive significance threshold [-log10 (1.027E-05)], respectively.

