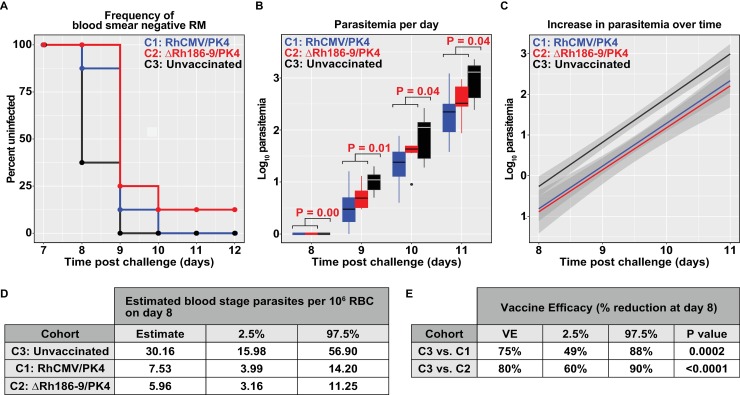
Fig 7. Blood stage parasitemia upon Spz challenge.
Each cohort was challenged with 100 Spz at day 0 and blood stage parasitemia was monitored daily by Giemsa stained thin blood smears starting at day 6 post-challenge. (A) Percent of animals without detectable parasitemia at the indicated days post-challenge. The percentage of uninfected RM is shown for each cohort: C1 = animals immunized with the RhCMV/PK4 vector panel, C2 = animals immunized with the ΔRh186-9/PK4 panel, C3 = non-immunized animals. (B) Boxplots of log10 parasitemia per 20,000 RBC at the indicated days show the median (horizontal line), interquartile range (shaded box), and range (whiskers and outlier points) among RM with detectable parasitemia, by day. Statistical significance as determined by unadjusted Wilcoxon test of C1 and C2 versus group C3 is shown above each plot. (C) Linear model fit to the log10-transformed parasitemia values with shaded bands indicating pointwise 95% confidence interval. The parasitemia data to days 8–11 fit a linear regression model and the intercepts for each of the vaccine groups differ significantly (P<0.0001, ANOVA F test, see Methods) from the control group whereas the slopes did not differ (P = 0.9262). This corresponds to an impact on the number of parasites present on day 8. (D) Estimated mean day 8 parasitemia by group and 95% confidence interval are shown in units of 106 RBC. These are estimated from the coefficients of the group terms in a simple linear model relating parasitemia over days 8–11 post-challenge to day and group, as described in Methods. (E) Estimated percent reduction in mean day 8 parasitemia by treated group when compared to control RM, with 95% confidence intervals. These are estimated from the coefficients of the group terms in a simple linear model relating parasitemia over days 8–11 post-challenge to day and group, as described in Methods.

