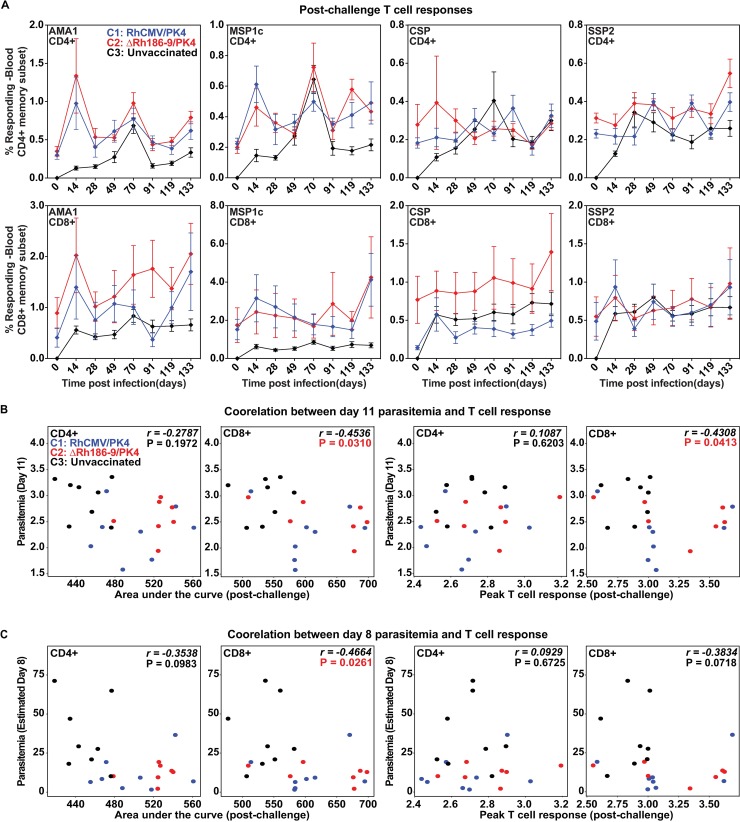
Fig 8. Immune responses in response to parasite challenge.
Animals in cohorts 1 and 2 were challenged with 100 PK Spz on day 273 after the first inoculation with RhCMV vectors. Animals in cohort 3 were challenged on the same day. AA) Average CD8+ and CD4+ T cell response frequencies (+/- SD) for each of the four antigens measured in the PBMC of the indicated cohorts by ICS at the indicated time points post-challenge. (B) Post-challenge CD8+ T cell levels correlate with reduced viremia. Scatterplots show association between post-challenge area under the ICS response measurement curve (AUC, left) or the Peak T cell response (right) versus observed Day 11 parasitemia (B) or estimated Day 8 parasitemia (C). Spearman rho (r) values and corresponding p-values shown on each panel indicate significant inverse correlations between CD8+ T cell responses and parasitemia outcome.

