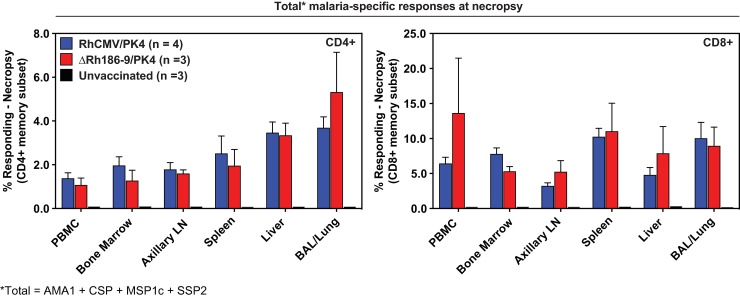
Fig 9. Post-challenge analysis of combined PK4-specific CD4+ and CD8+ T cell responses in individual tissues.
Flow cytometric ICS results of peripheral blood and tissue CD94+ and CD8+ T cell responses to the peptide mixes comprising each of the four PK antigens in 4 animals of cohort 1 (RhCMV/PK4), three animals of cohort 2 (ΔRh186-9/PK4) and three animals of control cohort 3. The sum of average response frequencies (+SEM), corrected for memory T cells, is shown for the indicated tissues. T cell response frequencies in the control cohort were below the detection limit.

