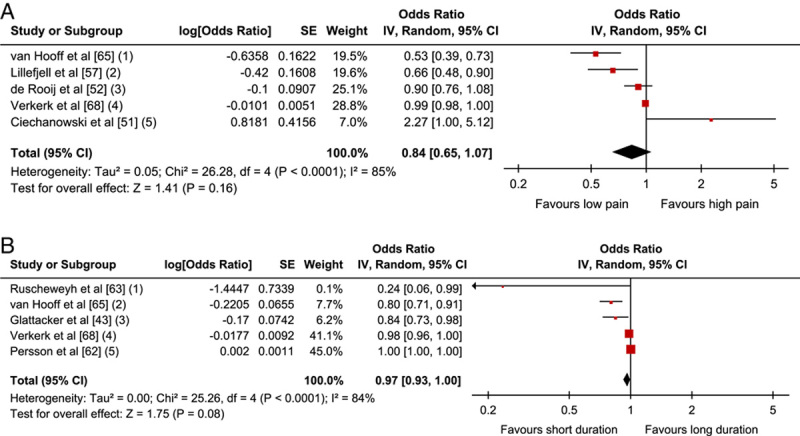
FIGURE 3.

Pain-related factors: A, Forest plot showing baseline pain intensity and association with positive outcome. B, Forest plot of comparison between pain duration and association with positive outcome. The assessment measures for outcome and prognostic factor (PF) reported and type of analyses are presented in the footnotes. 3A; (1) Outcome: ODI; PF: NRS; univariate; (2) Outcome: COOP-WONCA; PF: VAS; multivariate; (3) Outcome: MPI interference; PF: NRS; univariate; (4) Outcome: QBPDS, relative and absolute recovery; PF: VAS; multivariate. Combined OR; (5) Outcome: RMDQ; PF: NRS average pain intensity past week; zero-order correlations. 3B; (1) Outcome: PDI; PF: pain duration, self reported; (2) Outcome: ODI; PF: pain duration, self reported; (3) Outcome: SF-36 PF; PF: pain duration 0-5 years; multivariate; (4) Outcome: QBPDS, absolute change; PF: pain duration, self reported; (5) Outcome: COPM >2 change; PF: pain duration, self reported. CI indicates confidence interval; COPM, Canadian Occupational Performance Measure; ODI, Oswestry Disability Index; OR, odds ratio; PDI, Pain Disability Index; PF, Physical Functioning; QBPDS, Quebec Back Pain Disability Scale; SF-36, 36-Item Short Form Health Survey.
