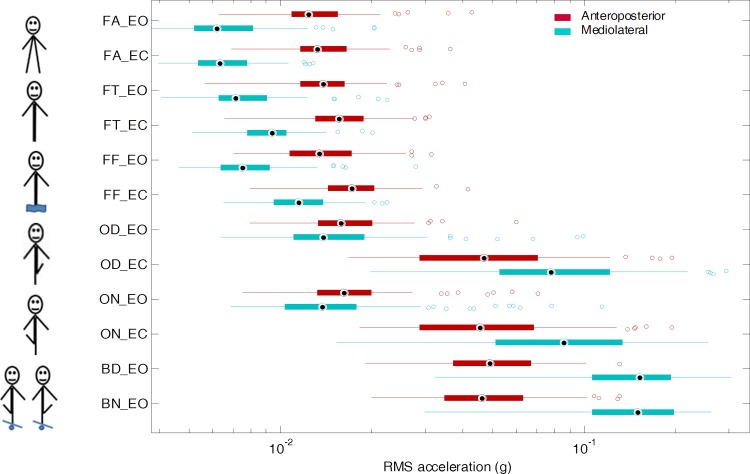
Fig 1. Descriptive statistics of sway amplitude.
One-hundred participants performed twelve 30-s standing tasks (see Table 2 for tasks description). Trunk sways were measured with an accelerometer. The root mean square (RMS) of the 30-s acceleration signals assessed the average amplitude of the sways. Boxplots show medians, quartiles, data extents, and outliers, separately for the AP and mediolateral axis. A logarithmic scale was used to enhance the visualization.

